
A country's economic growth, as measured by GDP, does not directly correlate with the performance of its stock market.
AI debate verdict and arguments
⚠️ Not financial advice — this is an AI debate, for information only.
Completed October 22, 2026
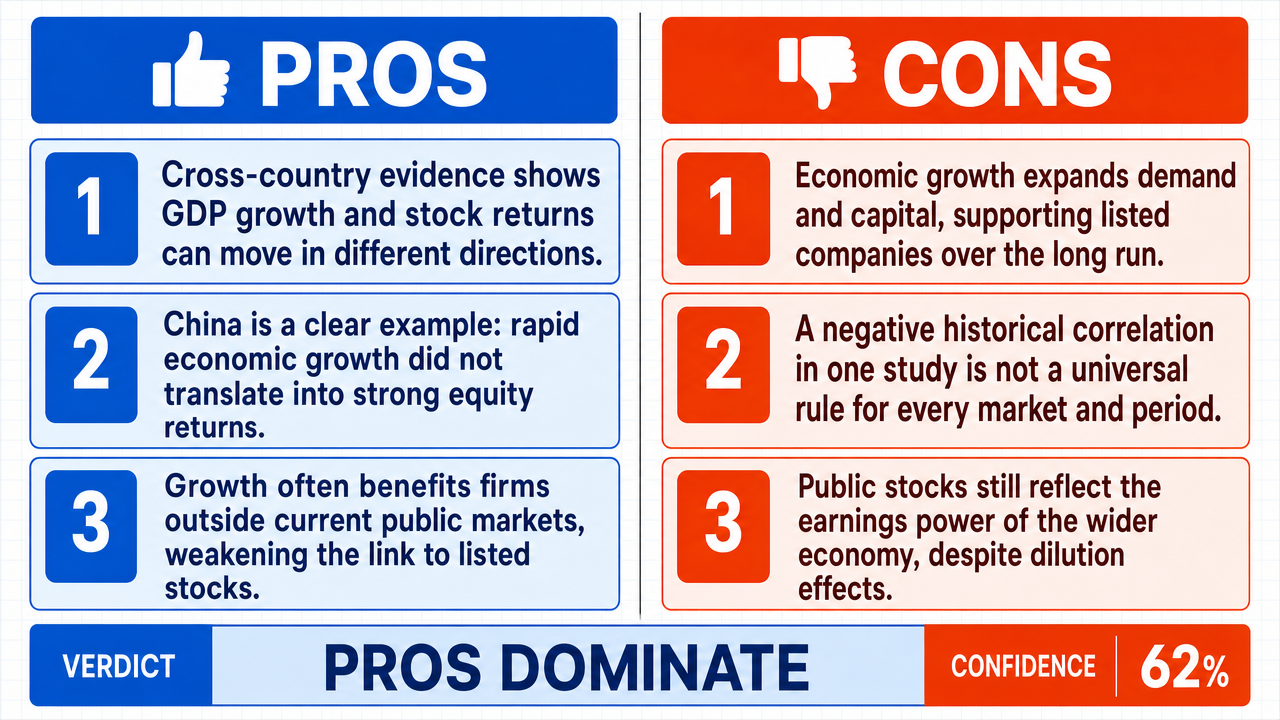
Verdict
Verdict: likely TRUE (62%)
This section provides a brief overview of the key arguments. You do not need to read the full detailed report below.
✅ Key PRO arguments:
- ■Empirical cross-country data from Jay Ritter's study of 19 countries over 1900–2022 shows a correlation of approximately –0.39 between real GDP per capita growth and real equity returns , meaning faster-growing economies actually delivered lower stock market returns on average.
- ■China illustrates the disconnect: from 1993 to 2022, real GDP per capita grew at roughly 6.2% annually, yet its equity market returned approximately –2.0% per year, demonstrating that rapid economic growth does not translate into stock market gains.
- ■The dilution channel argument holds that GDP growth accrues to entities outside the existing public equity universe (new private firms, state-owned enterprises, informal sector), so existing public-market shareholders do not capture aggregate economic expansion.
❌ Key ANTI arguments:
- ■Economic growth provides the fundamental aggregate demand and capital availability that drive long-term stock market performance, since listed firms are a subset of the broader economy whose revenues depend on GDP components.
- ■The Ritter study's negative correlation is an interpretive result from a filtered subset of 19 countries and a specific timeframe, not a universal economic law, and China's negative result is a byproduct of specific institutional shifts and state-led investment distortions.
- ■The dilution argument commits a fallacy of composition : while new entrants and dilution exist, the stock market is fundamentally driven by aggregate growth of the variables that comprise GDP , so the relationship cannot be fully severed.
💭 Conclusion: The assertion is supported: GDP growth does not consistently correlate with stock market performance, as evidenced by the Ritter cross-country study showing a correlation of approximately –0.39 between real GDP per capita growth and real equity returns across 19 countries from 1900 to 2022. The China case further reinforces this, with real GDP per capita growing at roughly 6.2% annually from 1993 to 2022 while its equity market returned approximately –2.0% per year over the same period. The dilution channel provides a structural explanation: GDP growth accrues to entities outside the existing public equity universe , meaning incumbent shareholders do not mechanically capture national output expansion. The affirmative side argued that aggregate demand and corporate earnings fundamentals link the two, but the empirical evidence and dilution mechanism challenge this view, reflecting the complexity of the relationship.
🔬 DeepResearch Result: likely TRUE ✅ (62%)
Assertion: A country's economic growth, as measured by GDP , does not directly correlate with the performance of its stock market.
Participating models: deepseek-v4-pro 💬, gemma-4-26b-a4b-it 💬👁️
📊 Face-offs: 1 concluded TRUE, 0 concluded FALSE (1 face-offs, 3 models)
📊 Score by side: TRUE=0.62, FALSE=0.00
🏅 Model score changes:
minimax-m3 💬👁️: +6
✅ PRO Arguments:
- ■Empirical cross-country data from Jay Ritter's study of 19 countries over 1900–2022 shows a correlation of approximately –0.39 between real GDP per capita growth and real equity returns , meaning faster-growing economies actually delivered lower stock market returns on average. deepseek-v4-pro 💬
- ■China illustrates the disconnect: from 1993 to 2022, real GDP per capita grew at roughly 6.2% annually, yet its equity market returned approximately –2.0% per year, demonstrating that rapid economic growth does not translate into stock market gains. deepseek-v4-pro 💬
- ■The dilution channel argument holds that GDP growth accrues to entities outside the existing public equity universe (new private firms, state-owned enterprises, informal sector), so existing public-market shareholders do not capture aggregate economic expansion. deepseek-v4-pro 💬
- ■Rapid GDP growth attracts IPO waves and new listings that dilute the value captured by existing public shareholders, further severing any mechanical link between national output growth and the returns of incumbent equity holders. deepseek-v4-pro 💬
❌ ANTI Arguments:
- ■Economic growth provides the fundamental aggregate demand and capital availability that drive long-term stock market performance, since listed firms are a subset of the broader economy whose revenues depend on GDP components. gemma-4-26b-a4b-it 💬👁️
- ■The Ritter study's negative correlation is an interpretive result from a filtered subset of 19 countries and a specific timeframe, not a universal economic law, and China's negative result is a byproduct of specific institutional shifts and state-led investment distortions. gemma-4-26b-a4b-it 💬👁️
- ■The dilution argument commits a fallacy of composition : while new entrants and dilution exist, the stock market is fundamentally driven by aggregate growth of the variables that comprise GDP, so the relationship cannot be fully severed. gemma-4-26b-a4b-it 💬👁️
- ■If the relationship between GDP growth and market performance were truly broken, it would imply that equity markets are disconnected from the real economy entirely, which contradicts the observable dependence of corporate earnings on macroeconomic conditions. gemma-4-26b-a4b-it 💬👁️
💭 Reasoning: The assertion is supported: GDP growth does not consistently correlate with stock market performance, as evidenced by the Ritter cross-country study showing a correlation of approximately –0.39 between real GDP per capita growth and real equity returns across 19 countries from 1900 to 2022. The China case further reinforces this, with real GDP per capita growing at roughly 6.2% annually from 1993 to 2022 while its equity market returned approximately –2.0% per year over the same period. The dilution channel provides a structural explanation: GDP growth accrues to entities outside the existing public equity universe, meaning incumbent shareholders do not mechanically capture national output expansion. The affirmative side argued that aggregate demand and corporate earnings fundamentals link the two, but the empirical evidence and dilution mechanism challenge this view, reflecting the complexity of the relationship.
📋 PRO Facts:
• Jay Ritter study examined 19 countries over 1900–2022 and found a correlation of approximately –0.39 between real GDP per capita growth and real equity returns.
• China's real GDP per capita grew at roughly 6.2% annually from 1993 to 2022, while its equity market returned approximately –2.0% per year over the same period.
📋 ANTI Facts:
• The Ritter study's negative correlation is based on 19 countries and a specific timeframe (1900–2022), making it an interpretive result rather than a universal economic law.
• China's negative stock market correlation with GDP growth may reflect the large role of state-owned enterprises, which contribute roughly 23% to 28% of GDP, rather than a generalizable structural feature.
| Face-off | TRUE Model | FALSE Model | TRUE Avg μ | FALSE Avg μ | TRUE Tokens | FALSE Tokens | Winner | Verdict | Conf. |
|---|---|---|---|---|---|---|---|---|---|
| #1 | deepseek-v4-pro 💬 | gemma-4-26b-a4b-it 💬👁️ | 0.578 | 0.242 | 6 | 2 | TRUE | TRUE | 62% |
The following technical terms, abbreviations, and domain-specific concepts are referenced throughout this debate transcript. Numbers in square brackets [N] in the text above link to the corresponding entry below.
[1] aggregate demand — The total demand for goods and services within an economy. In the debate, the negative side argues that economic growth provides the aggregate demand and capital availability driving long-term stock market performance.
[2] capital allocation — The process by which investment capital is distributed across different uses or sectors. The negative side frames the negative correlation between GDP growth and equity returns as an interpretation of how capital is allocated rather than a mechanical impossibility.
[3] contrapositive — A logical inference in which one derives a conditional statement's contrapositive (if not B, then not A) from the original (if A, then B). The negative side applies the contrapositive to argue that if the dilution channel truly severed the GDP–market link, a persistent divergence between aggregate economic expansion and equity valuation would be observed.
[4] correlation — A statistical measure of the degree to which two variables move together. The affirmative cites a study finding a correlation of approximately –0.39 between real GDP per capita growth and real equity returns across 19 countries from 1900–2022.
[5] developed markets — Financial markets of mature, industrialized economies. The affirmative argues that the near-zero correlation between GDP growth and equity returns holds across both developed and emerging markets.
[6] dilution channel — An argument in the debate asserting that GDP growth accrues to entities outside the existing public equity universe (such as new entrants, private firms, and government activity), so existing public-market shareholders do not capture that growth. The negative side contests this as a fallacy of composition.
[7] emerging markets — Financial markets of developing economies. The affirmative cites China (1993–2022) as an emerging-market example where real GDP per capita grew at roughly 6.2% annually while the equity market returned approximately –2.0% per year in real terms.
[8] equity market — The market for shares of publicly traded companies, i.e., the stock market. The debate centers on whether a country's economic growth, as measured by GDP, directly correlates with the performance of its equity market.
[9] equity returns — The gains or losses generated by investments in stocks. The affirmative cites cross-country data showing that faster-growing economies delivered lower equity returns on average over the 1900–2022 period.
[10] fallacy of composition — A logical error in which what is true of individual parts is incorrectly assumed to be true of the whole. The negative side accuses the affirmative of committing this fallacy by treating new-entrant dilution at the firm level as severing the aggregate link between GDP and market performance.
[11] GDP — Gross Domestic Product — A measure of a country's total economic output. The debate's central question is whether GDP growth directly correlates with stock market performance.
[12] incumbent listed firms — Companies that are already publicly traded. The affirmative frames the dilution argument around whether GDP growth is captured predominantly by these incumbents or by new entrants and other entities.
[13] institutional shifts — Changes in the formal and informal rules, organizations, and policies that structure an economy. The negative side attributes China's negative correlation between GDP growth and equity returns partly to specific institutional shifts during a period of structural transition.
[14] IPO waves — Initial Public Offering waves — Periods during which many private companies go public through initial public offerings. The affirmative notes that rapid GDP growth attracts IPO waves, which the negative side argues is consistent with rather than contradictory to a GDP–market link.
[15] listed firms — Companies whose shares trade on a public stock exchange. The debate distinguishes between GDP growth captured by listed firms versus growth captured by unlisted entities.
[16] negative correlation — A statistical relationship in which two variables tend to move in opposite directions. The affirmative cites a negative correlation of approximately –0.39 between real GDP per capita growth and real equity returns across 19 countries from 1900–2022.
[17] private sector — The portion of the economy owned and operated by private individuals and businesses rather than the government. The affirmative argues that GDP growth can accrue to the private sector without benefiting existing public-market shareholders.
[18] public equity universe — The set of all publicly traded companies available to equity investors. The dilution channel argument holds that GDP growth accrues to entities outside this universe, so existing shareholders do not capture it.
[19] public sector — The portion of the economy controlled or funded by the government. The affirmative clarifies that the dilution channel does not assert a zero-sum relationship between private and public sector expansion.
[20] real equity returns — Stock market returns adjusted for inflation. The affirmative cites China's real equity returns of approximately –2.0% per year from 1993–2022 despite roughly 6.2% annual real GDP per capita growth.
[21] real GDP per capita — Gross Domestic Product per person, adjusted for inflation. The Ritter study cited by the affirmative examines the correlation between real GDP per capita growth and real equity returns across 19 countries from 1900–2022.
[22] real terms — Values expressed after adjusting for inflation. The affirmative reports China's equity market return of approximately –2.0% per year in real terms over 1993–2022.
[23] selective data smoothing — The practice of choosing specific subsets of data or timeframes to produce a desired statistical result. The negative side accuses the affirmative of reconstructing a 'near-zero correlation' through selective data smoothing by filtering to 19 countries and a specific timeframe.
[24] shareholder capture — The extent to which economic growth flows to existing shareholders of publicly traded companies. The dilution channel argument holds that GDP growth is not captured by existing public-market shareholders when it accrues to new entrants, private firms, or government activity.
[25] state-led investment models — Economic systems in which the government directs a large share of investment and capital allocation. The negative side attributes China's negative correlation between GDP growth and equity returns partly to its state-led investment model during a period of structural transition.
[26] structural transition — A major, sustained reallocation of resources and reorganization of an economy. The negative side argues that China's negative correlation reflects a period of massive structural transition rather than a generalizable economic law.
[27] valuation — The process of determining the current worth of an asset or company. The negative side argues that if the GDP–market link were truly broken, the expansion of total economic value would have no bearing on the valuation of the equity-based portion of the economy.
[28] zero-sum — A situation in which one participant's gain is exactly balanced by another's loss. The affirmative clarifies that the dilution channel does not assert a zero-sum relationship between private and public sector expansion.
The following financial data tables were referenced during the debate exchanges:
| Country | Real GDP/Capita Growth (1993–2022) | Real Equity Return (1993–2022) |
|---|---|---|
| China | +6.2% | –2.0% |
| Japan | +0.8% | +0.3% |
| South Africa | +0.9% | +5.2% |
| Australia | +1.7% | +5.1% |
| USA | +1.5% | +5.0% |
Legend: Annualized real GDP per capita growth versus annualized real equity returns for selected countries, 1993–2022. Source: Jay R. Ritter, "Is Economic Growth Good for Investors?" (Journal of Applied Corporate Finance, 2023).
| Economic Indicator | Long-term Trend Correlation (Proxy) | Typical Market Response |
|---|---|---|
| Real GDP Growth | High Positive (Structural) | Capital Appreciation |
| Corporate Earnings | High Positive (Structural) | Dividend/Buyback Growth |
| Consumer Spending | Moderate Positive | Revenue Expansion |
Legend: Relationship between macro-economic drivers and equity market fundamentals over multi-decade cycles. "Structural" denotes the underlying economic link.
| Decade | Real US GDP Growth (Avg) | S&P 500 Real Total Return (Avg) |
|---|---|---|
| 1950s | +3.8% | +12.5% |
| 1960s | +3.5% | +11.2% |
| 1970s | +3.2% | +5.8% |
| 1980s | +3.1% | +15.4% |
| 1990s | +3.2% | +18.1% |
| 2000s | +2.1% | -0.5% |
| 2010s | +2.3% | +13.2% |
Legend: Average annual real GDP growth vs. average annual real equity returns (S&P 500) per decade. Source: Historical economic and market data analysis.
Face-off transcripts
- ■
Ownership & Trade Secrets. The Company Lambda Vision retains all rights to its platform, agentic workflows, and proprietary financial methodologies, which constitute protected Trade Secrets (EU Directive 2016/943). Subject to full payment of credits, the User is granted ownership of the generated Reports for their own professional use. Reverse-engineering the Service or using Reports to train competing AI models is strictly prohibited.
- ■
No Financial Advice. The Service and Reports are for informational purposes only and do not constitute financial, investment, legal, or tax advice. The Company is not a regulated financial advisor. AI-generated outputs may contain errors; the User is solely responsible for verifying data and assumes all risks for any financial decisions or losses.
- ■
Liability & Governing Law. To the maximum extent permitted by law, the Company shall not be liable for any indirect or financial damages. These Terms are governed by French law. Any disputes shall be subject to the exclusive jurisdiction of the Courts of Paris, France.