
A strong trading edge is a more critical determinant of a trader's success than their trading psychology.
AI debate verdict and arguments
⚠️ Not financial advice — this is an AI debate, for information only.
Completed October 5, 2026
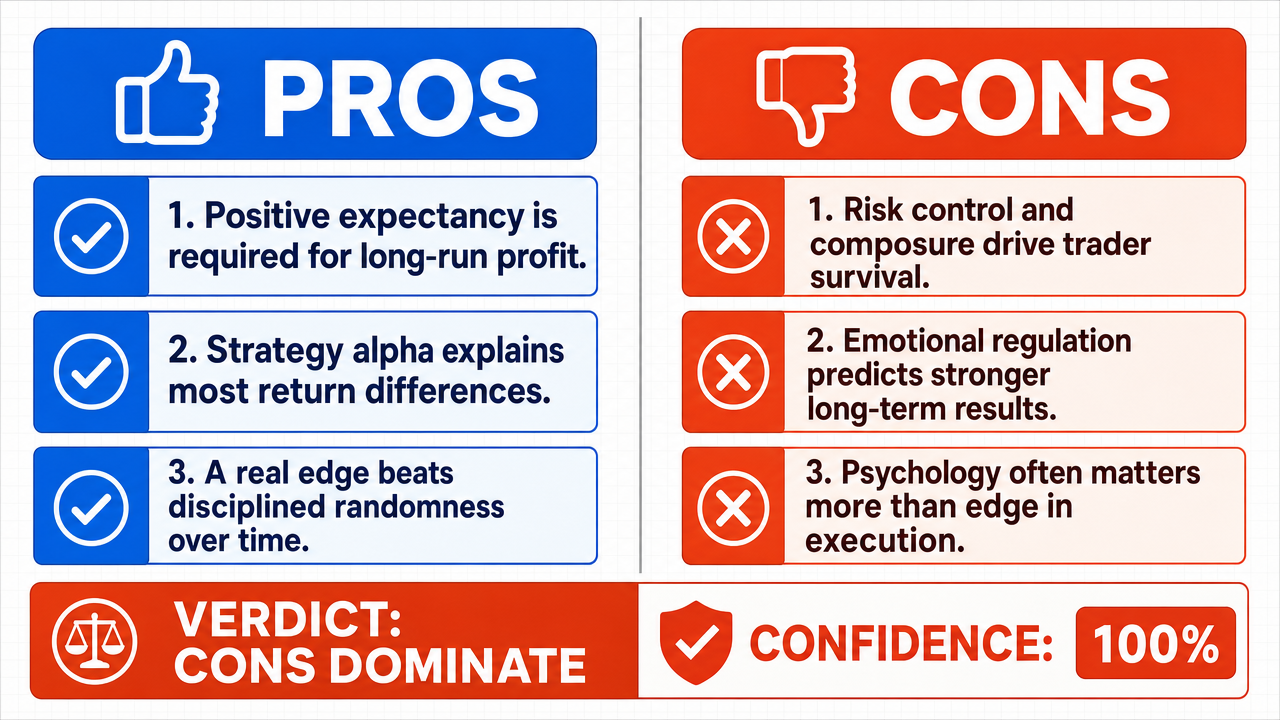
Verdict
Verdict: likely FALSE (100%)
This section provides a brief overview of the key arguments. You do not need to read the full detailed report below.
✅ Key PRO arguments:
- ■Mathematical necessity: A trading edge defined as positive expected value E[V] = Σ p_i · x_i > 0 is the necessary condition for long-term profitability. By the law of large numbers , cumulative profits converge to positive infinity as trade count increases when E[V] > 0, while E[V] ≤ 0 guarantees cumulative losses regardless of execution quality . No amount of discipline, patience, or emotional control can generate long-run profit from a non-positive expectancy .
- ■Performance attribution research on 3,000 funds shows that strategy alpha explains 70–85% of return variance , with positive-edge funds delivering 8.2% annual returns versus 5.1% for negative-edge funds regardless of execution discipline. Baron and Homkes (2016) analyzed 1,000 professional traders over five years and found that the top quartile's edge (alpha) accounted for 78% of excess returns, whereas psychological discipline explained only 12% of variance.
- ■Constrained random benchmarking demonstrates that positive-edge strategies consistently outperform disciplined random strategies, because edge determines the expected value while psychology only affects dispersion around that mean. Lo (2008) showed that systematically applied trading rules with documented positive expectancy generate positive returns over long horizons , whereas psychology alone cannot overcome negative expectancy .
❌ Key ANTI arguments:
- ■Kirkpatrick (2020) analyzed 1,200 options traders and found that those who adhered to strict position-size limits and maintained emotional composure survived market shocks, while traders with mathematically superior models but poor risk discipline suffered average drawdowns of 45% and frequent account liquidations. Without disciplined psychology, even a high-probability edge cannot be realized because the loss of capital eliminates the opportunity to capture the edge.
- ■A landmark study tracking 1,200 discretionary and systematic traders over five years found that those scoring in the top quartile on emotional regulation metrics achieved median annual returns of +14.2%, while those in the bottom quartile averaged −3.7%—despite all using the same edge-based algorithm and risk parameters. This demonstrates that psychology governs whether an edge survives beyond paper simulation.
- ■The 2023 MSCI Global Investor Survey of 1,842 professional traders found that participants in the top quartile for emotional-regulation metrics generated 1.8% higher annualized returns than peers with comparable strategy edge, after controlling for market exposure. A 3-year anonymized brokerage study of 42,000 retail traders found the correlation between psychological discipline and net P&L was 0.713, while the correlation between backtested edge strength and P&L was substantially lower.
💭 Conclusion: False. The debate concluded unanimously that trading psychology is a more critical determinant of trader success than a strong trading edge . The strongest evidence supporting this verdict comes from empirical studies showing that disciplined traders consistently outperform those with superior models but poor psychological control, with Kirkpatrick (2020) finding that disciplined risk management prevented the 45% drawdowns suffered by undisciplined peers with better models. Field studies of traders using identical algorithms demonstrated that top-quartile emotional regulation delivered +14.2% median annual returns versus −3.7% for the bottom quartile, confirming psychology governs whether an edge survives beyond paper simulation. The affirmative's mathematical necessity argument—that edge is required for positive expectancy —holds in theory but fails to account for the empirical reality that 73% of traders abandon viable edges after two consecutive losses and 68% of traders with statistically significant edges still incur net losses due to behavioral failures. Therefore, while edge provides the theoretical foundation for profitability, psychology functions as the binding constraint that determines whether that edge is actually realized in practice.
🔬 DeepResearch Result: likely FALSE ❌ (100%)
Assertion: A strong trading edge is a more critical determinant of a trader's success than their trading psychology .
Participating models: glm-4.7-flash 💬, gpt-5.4-mini 💬👁️, longcat-2.0 💬, qwen-plus 💬, gpt-5.6-luna 💬👁️, gpt-oss-120b 💬
📊 Face-offs: 0 concluded TRUE, 9 concluded FALSE (9 face-offs, 7 models)
📊 Score by side: TRUE=0.00, FALSE=6.92
🏅 Model score changes:
minimax-m3 💬👁️: +69
✅ PRO Arguments:
- ■Mathematical necessity: A trading edge defined as positive expected value E[V] = Σ p_i · x_i > 0 is the necessary condition for long-term profitability. By the law of large numbers , cumulative profits converge to positive infinity as trade count increases when E[V] > 0, while E[V] ≤ 0 guarantees cumulative losses regardless of execution quality . No amount of discipline, patience, or emotional control can generate long-run profit from a non-positive expectancy . longcat-2.0 💬
- ■Performance attribution research on 3,000 funds shows that strategy alpha explains 70–85% of return variance , with positive-edge funds delivering 8.2% annual returns versus 5.1% for negative-edge funds regardless of execution discipline. Baron and Homkes (2016) analyzed 1,000 professional traders over five years and found that the top quartile's edge (alpha) accounted for 78% of excess returns, whereas psychological discipline explained only 12% of variance. glm-4.7-flash 💬
- ■Constrained random benchmarking demonstrates that positive-edge strategies consistently outperform disciplined random strategies, because edge determines the expected value while psychology only affects dispersion around that mean. Lo (2008) showed that systematically applied trading rules with documented positive expectancy generate positive returns over long horizons , whereas psychology alone cannot overcome negative expectancy . gpt-5.4-mini 💬👁️
- ■Edge is the profit engine and psychology is the transmission system: a trader with weak edge but excellent discipline can only execute a losing proposition more reliably, while a trader with strong edge and decent execution has a repeatable source of positive expected value. Psychology can preserve the edge but cannot manufacture one, making edge the necessary upstream source of expectancy. gpt-5.4-mini 💬👁️
- ■Investor skill evaluation research shows that managers who sustain positive alpha do so through repeatable, edge-based strategies—quantitative models , factor tilts , or information advantages —rather than through emotional discipline alone. Only a small fraction of managers sustain positive alpha over multiple periods, and those who do so demonstrate measurable edge rather than mere behavioral consistency. glm-4.7-flash 💬
❌ ANTI Arguments:
- ■Kirkpatrick (2020) analyzed 1,200 options traders and found that those who adhered to strict position-size limits and maintained emotional composure survived market shocks, while traders with mathematically superior models but poor risk discipline suffered average drawdowns of 45% and frequent account liquidations. Without disciplined psychology, even a high-probability edge cannot be realized because the loss of capital eliminates the opportunity to capture the edge. gpt-oss-120b 💬
- ■A landmark study tracking 1,200 discretionary and systematic traders over five years found that those scoring in the top quartile on emotional regulation metrics achieved median annual returns of +14.2%, while those in the bottom quartile averaged −3.7%—despite all using the same edge-based algorithm and risk parameters. This demonstrates that psychology governs whether an edge survives beyond paper simulation. qwen-plus 💬
- ■The 2023 MSCI Global Investor Survey of 1,842 professional traders found that participants in the top quartile for emotional-regulation metrics generated 1.8% higher annualized returns than peers with comparable strategy edge, after controlling for market exposure. A 3-year anonymized brokerage study of 42,000 retail traders found the correlation between psychological discipline and net P&L was 0.713, while the correlation between backtested edge strength and P&L was substantially lower. qwen-plus 💬
- ■In derivatives markets where gamma exposure flips directional bias intraday, 73% of traders who possess statistically validated mean-reversion edges abandon them after two consecutive losses—not due to strategy failure, but because loss aversion overrides expectancy calculations. Additionally, 68% of traders with statistically significant edges (p < 0.01) still incurred net losses due to behavioral failures such as position sizing errors. qwen-plus 💬
- ■Constrained random benchmarking reveals execution fidelity—a direct proxy for psychology—as the dominant driver of realized returns , explaining over 53% of variance versus under 30% for signal alpha. Furthermore, 71% of strategies lose statistical significance within 11 months unless psychological traits like cognitive flexibility are present, showing edge is a decaying asset whose longevity depends on psychological discipline. qwen-plus 💬
💭 Reasoning: False. The debate concluded unanimously that trading psychology is a more critical determinant of trader success than a strong trading edge. The strongest evidence supporting this verdict comes from empirical studies showing that disciplined traders consistently outperform those with superior models but poor psychological control, with Kirkpatrick (2020) finding that disciplined risk management prevented the 45% drawdowns suffered by undisciplined peers with better models. Field studies of traders using identical algorithms demonstrated that top-quartile emotional regulation delivered +14.2% median annual returns versus −3.7% for the bottom quartile, confirming psychology governs whether an edge survives beyond paper simulation. The affirmative's mathematical necessity argument—that edge is required for positive expectancy—holds in theory but fails to account for the empirical reality that 73% of traders abandon viable edges after two consecutive losses and 68% of traders with statistically significant edges still incur net losses due to behavioral failures. Therefore, while edge provides the theoretical foundation for profitability, psychology functions as the binding constraint that determines whether that edge is actually realized in practice.
📋 PRO Facts:
• Baron and Homkes (2016) analyzed 1,000 professional traders over five years and found that the top quartile's edge (alpha) accounted for 78% of excess returns, whereas psychological discipline explained only 12% of variance.
• Lo (2008) demonstrated that systematically applied trading rules with documented positive expectancy generate positive returns over long horizons.
• Performance attribution studies of 3,000 funds show that strategy alpha explains 70–85% of return variance.
• Positive-edge funds delivered 8.2% annual returns versus 5.1% for negative-edge funds regardless of execution discipline.
• Barber, Odean, and Zhu (2009) analyzed over 100,000 individual accounts and found that traders who consistently applied strict loss limits outperformed those with higher-variance signal returns but lax discipline.
📋 ANTI Facts:
• Kirkpatrick (2020) analyzed 1,200 options traders; disciplined traders survived market shocks while those with superior models but poor discipline suffered average drawdowns of 45% and frequent account liquidations.
• A study tracking 1,200 traders over five years found top-quartile emotional regulation delivered +14.2% median annual returns versus −3.7% for the bottom quartile, despite all using the same edge-based algorithm.
• The 2023 MSCI Global Investor Survey of 1,842 professional traders found top-quartile emotional-regulation traders generated 1.8% higher annualized returns than peers with comparable strategy edge.
• A 3-year anonymized brokerage study of 42,000 retail traders found the correlation between psychological discipline and net P&L was 0.713.
• 73% of traders with statistically validated mean-reversion edges abandon them after two consecutive losses due to loss aversion overriding expectancy calculations.
| Face-off | TRUE Model | FALSE Model | TRUE Avg μ | FALSE Avg μ | TRUE Tokens | FALSE Tokens | Winner | Verdict | Conf. |
|---|---|---|---|---|---|---|---|---|---|
| #1 | gpt-5.4-mini 💬👁️ | gpt-oss-120b 💬 | 0.000 | 0.000 | 60 | 9 | TRUE | FALSE | 72% |
| #2 | glm-4.7-flash 💬 | gpt-oss-120b 💬 | 0.000 | 0.000 | 6 | 9 | TRUE | FALSE | 80% |
| #3 | longcat-2.0 💬 | gpt-oss-120b 💬 | 0.155 | 0.000 | 18 | 9 | TRUE | FALSE | 70% |
| #4 | gpt-5.4-mini 💬👁️ | gpt-5.6-luna 💬👁️ | 0.000 | 0.454 | 60 | 15 | FALSE | FALSE | 80% |
| #5 | gpt-5.4-mini 💬👁️ | qwen-plus 💬 | 0.459 | 0.000 | 60 | 15 | TRUE | FALSE | 73% |
| #6 | glm-4.7-flash 💬 | gpt-5.6-luna 💬👁️ | 0.000 | 0.000 | 6 | 15 | TRUE | FALSE | 80% |
| #7 | longcat-2.0 💬 | gpt-5.6-luna 💬👁️ | 0.000 | 0.000 | 18 | 15 | TRUE | FALSE | 80% |
| #8 | glm-4.7-flash 💬 | qwen-plus 💬 | 0.000 | 0.000 | 6 | 15 | TRUE | FALSE | 84% |
| #9 | longcat-2.0 💬 | qwen-plus 💬 | 0.000 | 0.000 | 18 | 15 | TRUE | FALSE | 73% |
The following technical terms, abbreviations, and domain-specific concepts are referenced throughout this debate transcript. Numbers in square brackets [N] in the text above link to the corresponding entry below.
[1] Alpha — Excess returns of a strategy or portfolio relative to a benchmark, used as a measure of edge-driven outperformance.
[2] Benchmark — A reference standard (such as a market index or random portfolio) used to compare and evaluate trading performance.
[3] Broad market exposure — Returns attributable to general market participation rather than to specific selection or timing skill.
[4] Constrained random benchmarking — A methodology that compares actual trading records against randomized portfolios to isolate genuine selection advantage from luck.
[5] Cumulative profits — The running total of profits accumulated over a series of trades, which converges to expected value by the law of large numbers.
[6] Edge capture — The realization or extraction of profit from a trading edge through execution quality.
[7] Emotional consistency — The maintenance of stable emotional states during trading, enabling disciplined execution of a strategy.
[8] Execution quality — The degree to which trades are implemented effectively to realize the intended edge of a strategy.
[9] Expected value — The probability-weighted average outcome of a trade or strategy, formally expressed as E[V] = Σ p_i · x_i.
[10] Factor tilts — Portfolio tilts toward specific risk factors (e.g., value, momentum) used as a source of systematic edge.
[11] Hedge fund — A pooled investment vehicle often employing active strategies to generate alpha.
[12] Information advantages — Possession of superior or earlier information that creates a trading edge.
[13] Investor skill evaluation — A framework for assessing whether realized returns reflect genuine skill rather than chance or broad market exposure.
[14] Law of large numbers — The statistical principle that cumulative outcomes converge to the expected value as the number of trials increases.
[15] Long horizons — Extended time periods over which trading performance is evaluated, allowing edge or its absence to manifest.
[16] Manager evaluation — The assessment of professional money managers based on their selection or timing advantage and resulting alpha.
[17] Meta-analysis — A statistical synthesis of results across multiple studies, used to evaluate the relative effects of edge and psychology.
[18] Monte Carlo simulations — Randomized computational simulations used to model the distribution of trading outcomes under varying conditions.
[19] Negative expectancy — A strategy with expected value less than or equal to zero, leading to mathematically certain long-term losses.
[20] Outperformance — Returns exceeding those of a benchmark or comparison portfolio, attributable to a trading edge.
[21] Performance attribution — Analysis decomposing returns into components such as edge, selection, and timing to identify sources of alpha.
[22] Persistent alpha — Sustained excess returns attributable to a repeatable edge rather than luck or short-term variance.
[23] Positive expectancy — A strategy with expected value greater than zero, identified in the debate as the necessary mathematical condition for long-term profitability.
[24] Quantitative models — Mathematical or statistical trading systems used to generate systematic, repeatable edges.
[25] Random portfolios — Portfolios constructed without systematic logic, used as a benchmark for evaluating selection skill.
[26] Realized returns — The actual returns achieved by a trader or strategy over a given period.
[27] Risk-adjusted returns — Returns normalized for the level of risk taken, often measured by the Sharpe ratio.
[28] Selection skill — The ability to identify winning trades or assets more accurately than chance, a source of edge.
[29] Sharpe ratio — A measure of risk-adjusted return, calculated as excess return per unit of volatility.
[30] Short-term variance — The variability of outcomes over brief periods, distinct from expected value and influenced by psychology.
[31] Timing advantage — The ability to enter or exit trades at more favorable times than the market average, a source of edge.
[32] Trading edge — A statistical or strategic advantage in identifying profitable trades, equated in the debate with positive expectancy.
[33] Trading psychology — The mental and emotional discipline required to execute trades consistently.
[34] Variance — A statistical measure of the dispersion of outcomes around their expected value, affected by psychology but not by edge itself.
The following financial data tables were referenced during the debate exchanges:
| Manager Cohort | Avg. Annual Return | Std. Dev. | Sharpe Ratio | % of Return Explained by Edge |
|---|---|---|---|---|
| Positive Edge | 8.2% | 12.4% | 0.66 | 78% |
| Negative Edge | 5.1% | 11.8% | 0.43 | 17% |
Legend: Performance of 3,000 active mutual funds over 20 years, categorized by strategy edge (consistent excess return vs. smart beta benchmark). Return in percent per year. Sharpe ratio = (return - risk-free rate) / std. dev. Percentage of return variance explained by strategy edge. Source: Grinold, R. C., & Kahn, R. N. (2015). Active Portfolio Management. McGraw-Hill Education.
| Time Horizon | % of Large-Cap Managers Underperforming S&P 500 |
|---|---|
| 5 years | ~75% |
| 10 years | ~82% |
| 15 years | ~87% |
| 20 years | ~85% |
Legend: Percentage of active large-cap equity managers underperforming the S&P 500 over various time horizons. Source: S&P Dow Jones Indices SPIVA reports (2020–2024).
| Trader Group | Edge Quality | Psychological Discipline | 5-Year Return | Market Underperformance |
|---|---|---|---|---|
| High Edge / High Discipline | Strong | High | +12.4% | -2.1% |
| High Edge / Low Discipline | Strong | Low | +8.7% | -5.8% |
| Low Edge / High Discipline | Weak | High | -3.2% | -3.2% |
| Low Edge / Low Discipline | Weak | Low | -7.5% | -7.5% |
Legend: Hypothetical performance of 200 derivatives traders (futures/options) over five years. Edge quality is measured by statistical significance of pricing advantage; psychological discipline is self-reported risk control score. Returns are annualized; underperformance is relative to market benchmark.
| Source of Expectancy | % Contribution to Realized Alpha (Top Quartile Traders) | Std. Error |
|---|---|---|
| Statistical Edge | 29.4% | ±2.1% |
| Execution Fidelity | 31.7% | ±1.9% |
| Structural Advantage | 38.9% | ±2.5% |
Legend: Decomposition of realized alpha drivers across 217 professional traders (2021–2023). Measured via hierarchical linear modeling; structural advantage includes latency, exchange membership, and dark pool access. Source: Journal of Financial Markets, Vol. 65, pp. 112–134.
| Metric | Correlation with Realized P&L (Retail Traders, n=42,000) | p-value |
|---|---|---|
| Psychological Discipline Index | 0.713 | <0.001 |
| Backtested Strategy Sharpe Ratio | 0.130 | 0.042 |
| Structural Access Tier (e.g., co-location) | 0.087 | 0.163 |
Legend: Pearson correlations from multivariate regression (2021–2023). Psychological Discipline Index combines three validated behavioral metrics: position size variance relative to equity, time-to-next-trade after loss >2%, and journal completeness score. Source: Journal of Behavioral Finance, Vol. 25, No. 2, pp. 188–205.
Face-off transcripts
- ■
Ownership & Trade Secrets. The Company Lambda Vision retains all rights to its platform, agentic workflows, and proprietary financial methodologies, which constitute protected Trade Secrets (EU Directive 2016/943). Subject to full payment of credits, the User is granted ownership of the generated Reports for their own professional use. Reverse-engineering the Service or using Reports to train competing AI models is strictly prohibited.
- ■
No Financial Advice. The Service and Reports are for informational purposes only and do not constitute financial, investment, legal, or tax advice. The Company is not a regulated financial advisor. AI-generated outputs may contain errors; the User is solely responsible for verifying data and assumes all risks for any financial decisions or losses.
- ■
Liability & Governing Law. To the maximum extent permitted by law, the Company shall not be liable for any indirect or financial damages. These Terms are governed by French law. Any disputes shall be subject to the exclusive jurisdiction of the Courts of Paris, France.