
A trading strategy based on initiating a trade after four consecutive down days in the SPY, given a historical maximum of seven down days, provides favorable odds for a winning trade within the subsequent three opportunities.
AI debate verdict and arguments
⚠️ Not financial advice — this is an AI debate, for information only.
Completed October 24, 2026
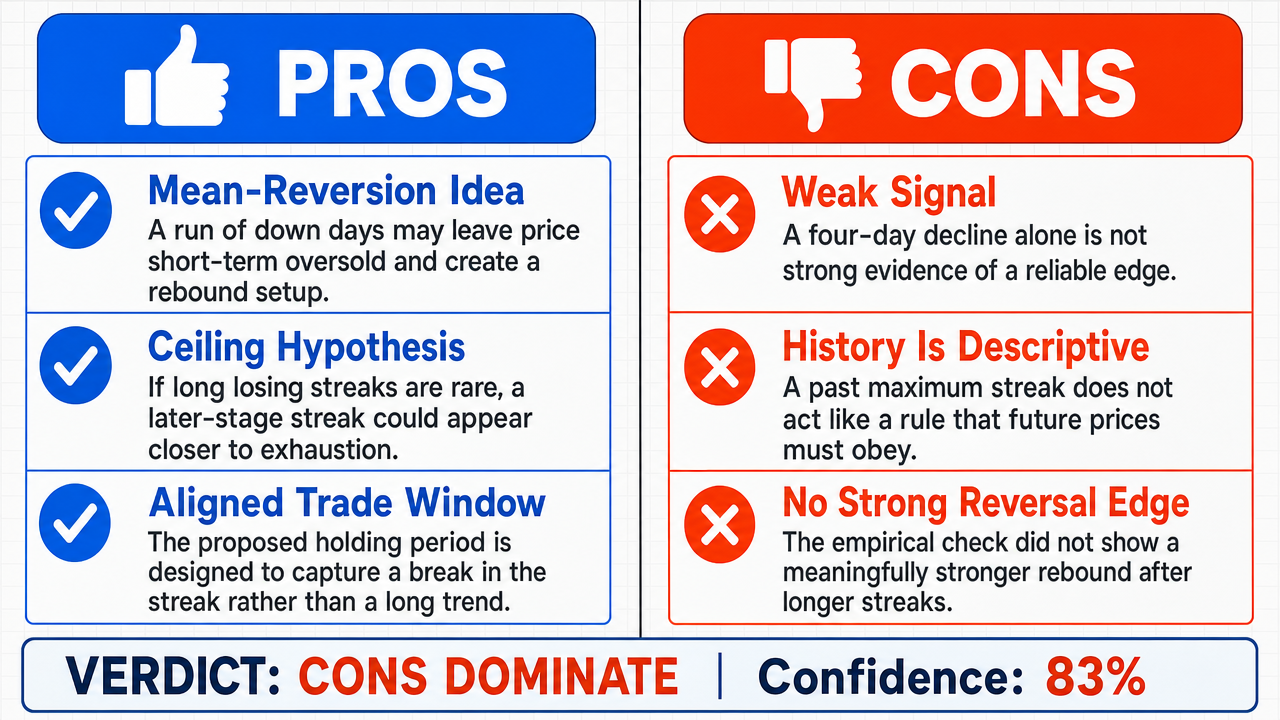
Verdict
Verdict: likely FALSE (83%)
This section provides a brief overview of the key arguments. You do not need to read the full detailed report below.
✅ Key PRO arguments:
- ■Consecutive down days in SPY create mean-reversion opportunities, so initiating a trade after four down days is proposed as exploiting short-term overextension rather than reacting to a purely random pattern.
- ■The historical maximum of seven consecutive down days is presented as a structural boundary: once a four-day streak occurs, the probability of it continuing for more than three additional days is described as statistically low, so the five-to-seven-day window offers a meaningful chance of a reversal.
- ■The strategy's three subsequent opportunities map directly onto days five through seven of a streak, aligning the trade horizon with the interval in which a break from the historical ceiling would have to occur.
❌ Key ANTI arguments:
- ■Four consecutive down days do not constitute a statistically significant trading signal: markets do not "remember" historical streak limits, and no causal mechanism links a fourth down day to a higher probability of reversal.
- ■The seven-day historical maximum is a descriptive endpoint rather than a structural constraint that creates predictive edge , so approaching that ceiling does not raise the odds of a reversal and the day-four entry is not a special pivot point .
- ■An empirical check of SPY daily closing prices over 20 years found the probability of a higher close four days later was 53% after 1 down day, 54% after 2, 55% after 3, 55% after 4, and 54% after 5, showing no increasing advantage as the streak lengthens.
💭 Conclusion: False: the winning side established that the historical seven-day maximum is a descriptive fact rather than a predictive constraint, and its empirical check found no reversal advantage that grows with streak length. Across 20 years of SPY daily closing prices , the probability of a higher close four days later was 53% after 1 down day, 54% after 2, 55% after 3, 55% after 4, and 54% after 5, so the figures do not show reversal odds rising as the streak deepens. The affirmative argument relied on mean-reversion intuition and the idea that approaching the seven-day ceiling makes a reversal more likely, but it supplied no measured win probability for the specific three trading days following a four-day streak. The negative side's test measured a four-day-ahead close rather than the strategy's exact three-opportunity window, so the strongest available evidence is the absence of a demonstrated edge rather than a proven impossibility of profit. On balance, because no win probability was established for the specified three-opportunity horizon and the one empirical check showed no increase in reversal odds with streak length, the assertion's claim of favorable odds is unsupported.
🔬 DeepResearch Result: likely FALSE ❌ (83%)
Assertion: A trading strategy based on initiating a trade after four consecutive down days in the SPY, given a historical maximum of seven down days, provides favorable odds for a winning trade within the subsequent three opportunities.
Participating models: gemma-4-26b-a4b-it 💬👁️, glm-4.7-flash 💬
📊 Face-offs: 0 concluded TRUE, 1 concluded FALSE (1 face-offs, 3 models)
📊 Score by side: TRUE=0.00, FALSE=0.83
🏅 Model score changes:
minimax-m3 💬👁️: +8
✅ PRO Arguments:
- ■Consecutive down days in SPY create mean-reversion opportunities, so initiating a trade after four down days is proposed as exploiting short-term overextension rather than reacting to a purely random pattern. gemma-4-26b-a4b-it 💬👁️
- ■The historical maximum of seven consecutive down days is presented as a structural boundary: once a four-day streak occurs, the probability of it continuing for more than three additional days is described as statistically low, so the five-to-seven-day window offers a meaningful chance of a reversal. gemma-4-26b-a4b-it 💬👁️
- ■The strategy's three subsequent opportunities map directly onto days five through seven of a streak, aligning the trade horizon with the interval in which a break from the historical ceiling would have to occur. gemma-4-26b-a4b-it 💬👁️
- ■The observed frequency of four-day down patterns was characterized as a documented characteristic of market volatility and mean reversion , with the small-sample and multiple-testing critique rejected as an overstatement about an empirically documented market behavior. gemma-4-26b-a4b-it 💬👁️
❌ ANTI Arguments:
- ■Four consecutive down days do not constitute a statistically significant trading signal: markets do not "remember" historical streak limits, and no causal mechanism links a fourth down day to a higher probability of reversal. glm-4.7-flash 💬
- ■The seven-day historical maximum is a descriptive endpoint rather than a structural constraint that creates predictive edge , so approaching that ceiling does not raise the odds of a reversal and the day-four entry is not a special pivot point . glm-4.7-flash 💬
- ■An empirical check of SPY daily closing prices over 20 years found the probability of a higher close four days later was 53% after 1 down day, 54% after 2, 55% after 3, 55% after 4, and 54% after 5, showing no increasing advantage as the streak lengthens. glm-4.7-flash 💬
- ■The affirmative side presented no measured win probability for the specific three-trading-day window following a four-day down streak, leaving the strategy's claimed favorable odds unsupported by evidence. glm-4.7-flash 💬
- ■Trading on this pattern conflates correlation with causation , and the small number of observed streaks makes any estimated reversal probability unreliable. glm-4.7-flash 💬
💭 Reasoning: False: the winning side established that the historical seven-day maximum is a descriptive fact rather than a predictive constraint, and its empirical check found no reversal advantage that grows with streak length. Across 20 years of SPY daily closing prices, the probability of a higher close four days later was 53% after 1 down day, 54% after 2, 55% after 3, 55% after 4, and 54% after 5, so the figures do not show reversal odds rising as the streak deepens. The affirmative argument relied on mean-reversion intuition and the idea that approaching the seven-day ceiling makes a reversal more likely, but it supplied no measured win probability for the specific three trading days following a four-day streak. The negative side's test measured a four-day-ahead close rather than the strategy's exact three-opportunity window, so the strongest available evidence is the absence of a demonstrated edge rather than a proven impossibility of profit. On balance, because no win probability was established for the specified three-opportunity horizon and the one empirical check showed no increase in reversal odds with streak length, the assertion's claim of favorable odds is unsupported.
📋 PRO Facts:
• The debate premise states a historical maximum of seven consecutive down days in SPY.
• The affirmative model argued that after a four-day streak the historical ceiling leaves only days five through seven as the relevant reversal window.
• The affirmative model characterized repeated four-day down sequences as a documented feature of market volatility and mean reversion.
• The affirmative model rejected the view that observed four-day down patterns are merely random artifacts of small-sample and multiple-testing effects.
📋 ANTI Facts:
• Twenty years of SPY daily closing prices were retrieved and analyzed by the negative model.
• Probability of a higher close four days later: 53% after 1 down day, 54% after 2, 55% after 3, 55% after 4, and 54% after 5.
• The negative model's conclusion was that no empirical evidence showed reversal probability at day 4 to be higher than at day 1.
• No win probability was presented for the exact three-opportunity window following a four-day down streak.
• The judge ruled FALSE with 83% confidence, and the FALSE side won the confidence-weighted vote 0.83 to 0.00.
| Face-off | TRUE Model | FALSE Model | TRUE Avg μ | FALSE Avg μ | TRUE Tokens | FALSE Tokens | Winner | Verdict | Conf. |
|---|---|---|---|---|---|---|---|---|---|
| #1 | gemma-4-26b-a4b-it 💬👁️ | glm-4.7-flash 💬 | 0.183 | 0.249 | 4 | 4 | FALSE | FALSE | 83% |
The following technical terms, abbreviations, and domain-specific concepts are referenced throughout this debate transcript. Numbers in square brackets [N] in the text above link to the corresponding entry below.
[1] autocorrelation — The degree to which a variable is associated with its own earlier values. The affirmative side treats significant autocorrelation in market volatility as evidence against an i.i.d. model.
[2] broad-based negative sentiment — Market-wide negative sentiment, invoked to explain why a fourth down day in a diversified index can reflect a common mood that persists rather than a setup for mean reversion.
[3] consecutive down days — A sequence of trading days in which SPY closes lower than on the preceding day. The debate examines runs of four through seven days as possible reversal signals.
[4] correlation with causation — The distinction between a pattern being associated with an outcome and actually causing it. The negative side argues that the down-day streak has an association but no causal reversal mechanism.
[5] daily closing prices — SPY's end-of-day price observations, used by the negative side to calculate the chance of a higher close after different streak lengths.
[6] diversification — Exposure spread across the S&P 500's components. The negative side says this makes a fourth down day broad-based, although the negative sentiment can persist.
[7] downward momentum — The tendency of a price decline to continue for several sessions. The affirmative side argues that after four down days, this momentum may be approaching exhaustion.
[8] empirical probabilities — The negative side reports 53%, 54%, 55%, 55%, 54%, and 53% likelihoods of a higher close four days after streaks of one through six down days, respectively. It treats the small difference from 50% as negligible.
[9] equity indices — Indexes of broad equity-market performance, cited by the affirmative side as the setting in which mean reversion is said to be documented.
[10] exhaustion of the downward momentum — The proposition that a sustained decline may weaken near an observed streak limit and thus become more likely to reverse. The negative side disputes that approaching seven days changes reversal odds.
[11] GARCH — Generalized Autoregressive Conditional Heteroskedasticity — A volatility-modeling framework invoked by the affirmative side as a description of volatility clustering and departures from i.i.d. behavior.
[12] heterogeneous information sets — Different information sets across the components of an index. The negative side says this can produce consecutive down days without a unified mean-reversion force.
[13] historical maximum streak — The longest observed SPY run of consecutive down days, stated as seven in the debate. The affirmative side treats it as a structural ceiling; the negative side says it is descriptive and does not make day 4 more predictive.
[14] i.i.d. — independent, identically distributed — An assumption that observations are independent and identically distributed. The affirmative side says market volatility violates this assumption because it exhibits autocorrelation and clustering.
[15] long-term average price level — The average price benchmark toward which an asset is expected to return under the mean-reversion hypothesis. The affirmative side links that return to a prior period of excessive selling pressure.
[16] macroeconomic factors — Economy-wide conditions invoked as reasons that negative sentiment and a market decline can persist.
[17] market volatility — The variability of market movements. The affirmative side emphasizes that volatility is not i.i.d. but instead exhibits autocorrelation and clustering.
[18] mean reversion — The hypothesis that an asset price tends to return toward a long-term average after unusually strong selling. The affirmative side invokes it as support for a reversal strategy, while the negative side says the streak pattern does not demonstrate predictable reversion.
[19] multiple-testing bias — The risk that chance findings appear meaningful when many patterns are tested. It is part of the negative side's reliability challenge, which the affirmative side contests.
[20] pivot point — A proposed turning point in a sequence. The negative side specifically rejects the claim that day 4 of a down streak is a special pivot point.
[21] predictive edge — A repeatable ability to forecast future outcomes or outperform a baseline. The negative side argues that the four-day streak provides no empirically supported predictive edge.
[22] predictive validity — The capacity of an observed pattern to forecast future results. The debate disputes whether streak frequencies have predictive validity or are merely random artifacts.
[23] random 50% baseline — A 50% benchmark used to judge whether an estimated reversal probability differs from chance. The negative side argues that the reported 53%-55% probabilities provide only a negligible advantage over this baseline.
[24] returns — Price changes measured over a period. The debate discusses serial correlation in returns as a feature of financial markets.
[25] reversal probability — The likelihood that SPY closes higher after a decline or down-day streak. The affirmative side expects it to rise within days five through seven, while the negative side reports no systematic elevation as streak length approaches seven.
[26] selling pressure — Strong selling activity that pushes prices downward. The affirmative side describes excessive selling pressure as a condition that can precede a mean-reverting rebound.
Face-off transcripts
- ■
Ownership & Trade Secrets. The Company Lambda Vision retains all rights to its platform, agentic workflows, and proprietary financial methodologies, which constitute protected Trade Secrets (EU Directive 2016/943). Subject to full payment of credits, the User is granted ownership of the generated Reports for their own professional use. Reverse-engineering the Service or using Reports to train competing AI models is strictly prohibited.
- ■
No Financial Advice. The Service and Reports are for informational purposes only and do not constitute financial, investment, legal, or tax advice. The Company is not a regulated financial advisor. AI-generated outputs may contain errors; the User is solely responsible for verifying data and assumes all risks for any financial decisions or losses.
- ■
Liability & Governing Law. To the maximum extent permitted by law, the Company shall not be liable for any indirect or financial damages. These Terms are governed by French law. Any disputes shall be subject to the exclusive jurisdiction of the Courts of Paris, France.