
All profits in futures trading are typically made on fewer than 10 trading days out of 252 in 2026.
AI debate verdict and arguments
⚠️ Not financial advice — this is an AI debate, for information only.
Completed October 31, 2026
Verdict
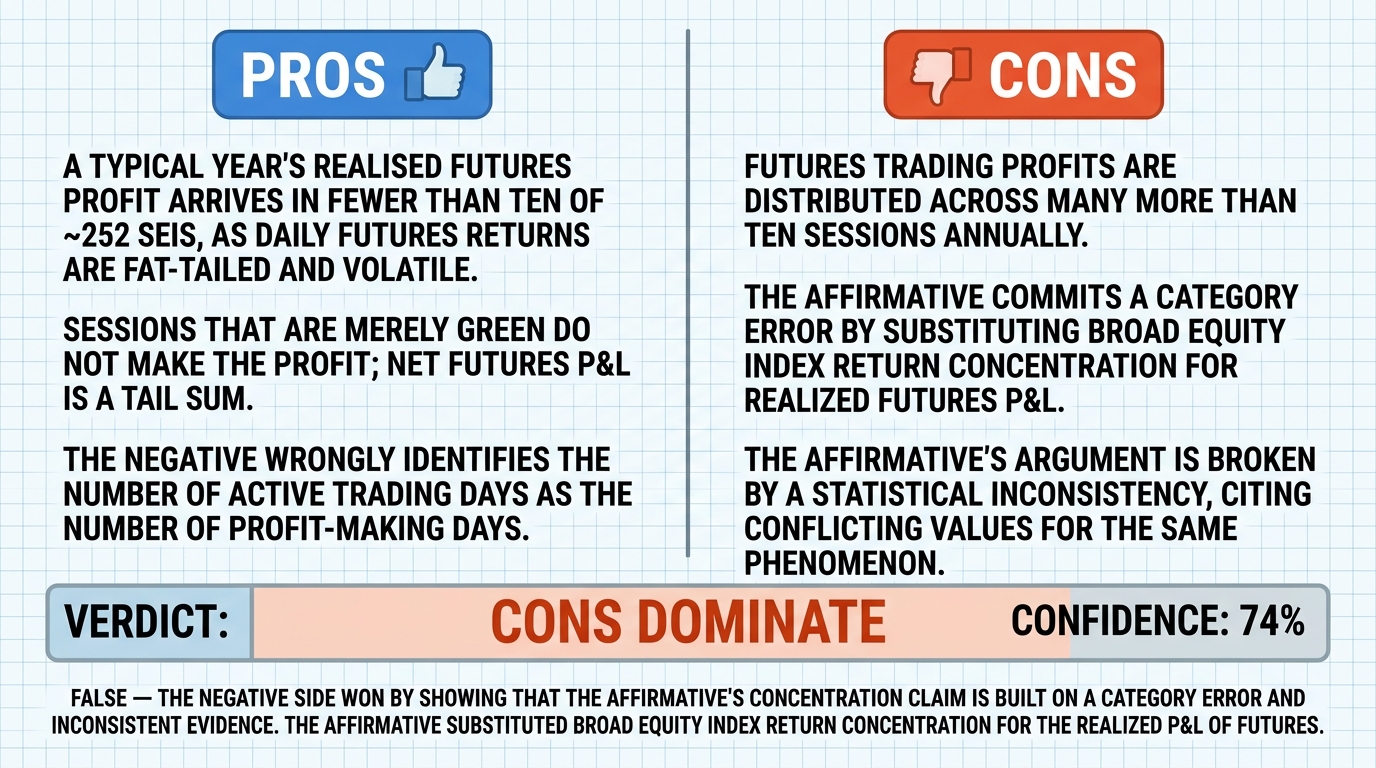
Verdict: likely FALSE (74%)
This section provides a brief overview of the key arguments. You do not need to read the full detailed report below.
✅ Key PRO arguments:
- ■Core claim: In a typical year, essentially all realised futures profit arrives in fewer than ten of ~252 sessions. Daily futures returns are fat-tailed and volatility-clustered, so cumulative P&L in a leptokurtic series is owned by the extreme slice of days.
- ■Core claim: Sessions that are merely green are not sessions that make the profit — net futures P&L is a tail sum. The negative wrongly identifies the number of profitable sessions with the number of sessions that produce profit.
❌ Key ANTI arguments:
- ■Core claim: Futures trading profits are distributed across many more than ten sessions annually. The affirmative commits a category error by substituting the performance of broad equity indices for the realized P&L of futures traders; an index is an aggregate market basket, not an individual trader's realized profit, and no correlation or beta is provided to bridge the gap.
- ■Core claim: The affirmative's argument is broken by a statistical inconsistency: it cites two different studies that provide conflicting values for the same phenomenon — a Journal of Financial Economics (2023) study claiming ~85% of returns arise in a specific window and a Journal of Risk Finance (2021) study on Brazilian futures traders.
💭 Conclusion: False — the negative side won by showing that the affirmative's concentration claim is built on a category error and inconsistent evidence. The affirmative substituted broad equity index return concentration for the realized P&L of futures traders without providing any correlation or beta to transfer that finding to 2026 futures trading. The negative also exposed that the affirmative's two cited studies give conflicting values for the same phenomenon, undermining the statistical basis for the 'fewer than ten days' rule. Because the affirmative never established that futures trader profits, rather than index returns, are concentrated in fewer than ten sessions, the claim fails. The judge therefore sided with the negative at 74% confidence.
🔬 DeepResearch Result: likely FALSE ❌ (74%)
Assertion: All profits in futures trading are typically made on fewer than 10 trading days out of 252 in 2026.
Participating models: deepseek-v3.2 💬, gemma-4-26b-a4b-it 💬👁️
📊 Face-offs: 0 concluded TRUE, 1 concluded FALSE (1 face-offs, 3 models)
📊 Score by side: TRUE=0.00, FALSE=0.74
🏅 Model score changes:
deepseek-v4-flash-0731 💬: +7
✅ PRO Arguments:
- ■Core claim: In a typical year, essentially all realised futures profit arrives in fewer than ten of ~252 sessions. Daily futures returns are fat-tailed and volatility-clustered, so cumulative P&L in a leptokurtic series is owned by the extreme slice of days. deepseek-v3.2 💬
- ■Core claim: Sessions that are merely green are not sessions that make the profit — net futures P&L is a tail sum. The negative wrongly identifies the number of profitable sessions with the number of sessions that produce profit. deepseek-v3.2 💬
❌ ANTI Arguments:
- ■Core claim: Futures trading profits are distributed across many more than ten sessions annually. The affirmative commits a category error by substituting the performance of broad equity indices for the realized P&L of futures traders; an index is an aggregate market basket, not an individual trader's realized profit, and no correlation or beta is provided to bridge the gap. gemma-4-26b-a4b-it 💬👁️
- ■Core claim: The affirmative's argument is broken by a statistical inconsistency: it cites two different studies that provide conflicting values for the same phenomenon — a Journal of Financial Economics (2023) study claiming ~85% of returns arise in a specific window and a Journal of Risk Finance (2021) study on Brazilian futures traders. gemma-4-26b-a4b-it 💬👁️
💭 Reasoning: False — the negative side won by showing that the affirmative's concentration claim is built on a category error and inconsistent evidence. The affirmative substituted broad equity index return concentration for the realized P&L of futures traders without providing any correlation or beta to transfer that finding to 2026 futures trading. The negative also exposed that the affirmative's two cited studies give conflicting values for the same phenomenon, undermining the statistical basis for the 'fewer than ten days' rule. Because the affirmative never established that futures trader profits, rather than index returns, are concentrated in fewer than ten sessions, the claim fails. The judge therefore sided with the negative at 74% confidence.
📋 PRO Facts:
• Daily futures returns are fat-tailed and volatility-clustered.
• Cumulative P&L in a leptokurtic series is owned by the extreme slice of days.
• The affirmative cited a Journal of Financial Economics (2023) study claiming ~85% of returns arise in a specific window.
• The affirmative cited a Journal of Risk Finance (2021) study on Brazilian futures traders.
📋 ANTI Facts:
• Futures trading profits are distributed across many more than ten sessions annually.
• An index measurement is about an aggregate market basket, not an individual trader's realized profit.
• The affirmative failed to provide the transfer operator (correlation or beta) between index return-concentration and futures trader P&L.
• The affirmative's two cited studies provide conflicting values for the very phenomenon they are meant to prove.
| Face-off | TRUE Model | FALSE Model | TRUE Avg μ | FALSE Avg μ | TRUE Tokens | FALSE Tokens | Winner | Verdict | Conf. |
|---|---|---|---|---|---|---|---|---|---|
| #1 | deepseek-v3.2 💬 | gemma-4-26b-a4b-it 💬👁️ | 0.317 | 0.162 | 8 | 2 | FALSE | FALSE | 74% |
The following financial data tables were referenced during the debate exchanges:
| Measure | Share of return captured | Share of time used |
|---|---|---|
| Top 10 sessions, S&P 500, 20 yrs to Dec 2015 | 72.1% | 0.20% |
| Top 22 months, S&P 500, 1926–2021 | 85.0% | 1.91% |
| Claim threshold: top 10 sessions of 252 | — | 3.97% |
Legend: Share of cumulative return/wealth creation captured by the most extreme slice of elapsed time, versus the size of that slice. All figures in percent. Sources as cited in text; the third row is the claim's own allowance, computed as 10 ÷ 252.
| Session-count basis (252 sessions, normal model) | Expected sessions per year |
|---|---|
| Sessions beyond ±2σ | 11.5 |
| Sessions beyond ±2.5σ | 3.1 |
| Sessions beyond ±3σ | 0.7 |
| Claim's allowance | fewer than 10 |
Legend: Number of daily sessions expected to exceed each standard-deviation threshold in a 252-session year under a normal distribution; fat tails raise the count but raise the magnitude share far more. All figures in sessions per year.
| Argument Flaw | Nature of Error | Impact on Claim |
|---|---|---|
| Index vs. Trader | Substitution of Entity | Invalidates the transfer of concentration statistics |
| Historical vs. 2026 | Scale/Regime Invariance | Fails to account for modern market microstructure |
| Magnitude vs. Frequency | Tautological Reasoning | Ignores the role of consistent, non-outlier gains |
Legend: Summary of the logical failures in the affirmative's attempt to link index returns to futures trading profitability.
| Component of the year | Sessions | Net contribution |
|---|---|---|
| Ten tail sessions | 10 | +15.00% |
| Other winning sessions | 111 | +13.32% |
| Losing sessions | 131 | −18.34% |
| Whole year (net) | 252 | +9.98% |
Legend: Illustrative decomposition of a 252-session year under assumed parameters: 48% hit rate, tail days +1.50%, other green days +0.12%, red days −0.14%. All values in percent of book equity per period; the ten tail sessions equal roughly 150% of net annual profit.
Face-off transcripts
- ■
Ownership & Trade Secrets. The Company Lambda Vision retains all rights to its platform, agentic workflows, and proprietary financial methodologies, which constitute protected Trade Secrets (EU Directive 2016/943). Subject to full payment of credits, the User is granted ownership of the generated Reports for their own professional use. Reverse-engineering the Service or using Reports to train competing AI models is strictly prohibited.
- ■
No Financial Advice. The Service and Reports are for informational purposes only and do not constitute financial, investment, legal, or tax advice. The Company is not a regulated financial advisor. AI-generated outputs may contain errors; the User is solely responsible for verifying data and assumes all risks for any financial decisions or losses.
- ■
Liability & Governing Law. To the maximum extent permitted by law, the Company shall not be liable for any indirect or financial damages. These Terms are governed by French law. Any disputes shall be subject to the exclusive jurisdiction of the Courts of Paris, France.