
An investment strategy that avoids large positions when an asset's price is below its 200-day moving average and that average trends down will outperform one that does not over a multi-year horizon.
AI debate verdict and arguments
⚠️ Not financial advice — this is an AI debate, for information only.
Completed October 20, 2026
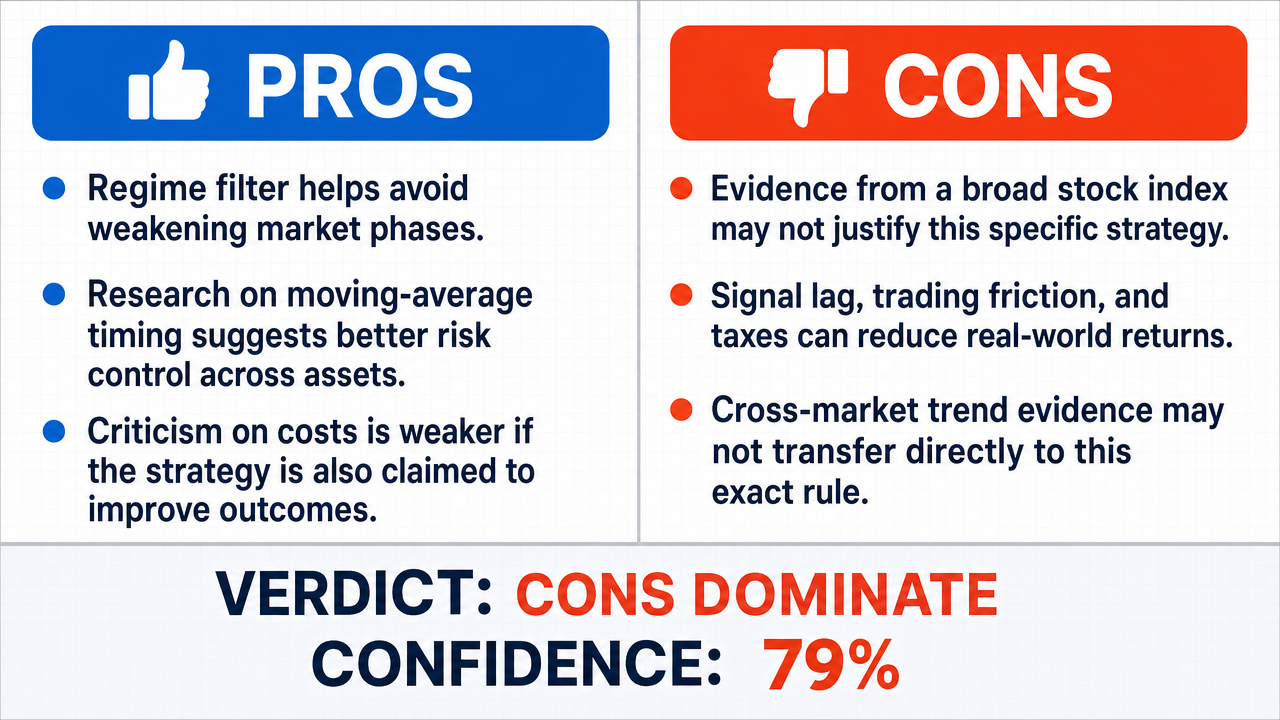
Verdict
Verdict: likely FALSE (79%)
This section provides a brief overview of the key arguments. You do not need to read the full detailed report below.
✅ Key PRO arguments:
- ■The 200-day moving average acts as a regime filter separating constructive market environments from deteriorating ones; when price is below a declining 200-day MA , both level and slope confirm weakness, so avoiding large positions protects capital during the most destructive phases of the market cycle where drawdowns are deep and recoveries are prolonged.
- ■Cites Mebane Faber's research in 'The Ivy Portfolio ' (2009), which demonstrated that a simple 10-month moving average timing rule applied across asset classes improved risk-adjusted returns , providing empirical support for the dual-filter (price-below-MA and declining-MA) approach.
- ■Argues that the opposing case on transaction costs and tax drag is internally inconsistent, since it simultaneously concedes the strategy is claimed to outperform while asserting net returns are insufficient to do so.
❌ Key ANTI arguments:
- ■The affirmative's reliance on 1900–2008 S&P 500 data is a substitution error : a measurement of a highly diversified, large-cap equity index cannot support a universal conclusion about 'an asset,' which encompasses volatile commodities, individual equities, and currencies with very different return distributions.
- ■Trend-following rules introduce significant lag and transaction costs that erode long-term returns, meaning the gross outperformance documented in backtests may not survive realistic frictions over a multi-year horizon .
- ■The claimed 'cross-asset robustness ' based on the AQR study (Hurst, Ooi, and Pedersen, 2017) covering 67 markets is overstated because that robustness is a property of market liquidity and price formation, not of the signal itself; in many asset classes —emerging market currencies , certain commodities, and many fixed-income instruments—the signal fails.
💭 Conclusion: False. The winning side convincingly argued that the affirmative's evidence base—primarily long-run S&P 500 backtests and a multi-market AQR study—suffers from a substitution error , since results on a diversified large-cap equity index do not generalize to the broad universe of assets the assertion covers. The anti side further demonstrated that the apparent robustness of the 200-day MA rule is contingent on market liquidity and continuous price formation, conditions that fail in many emerging market currencies , commodities, and fixed-income instruments. Transaction costs and signal lag were shown to erode the gross outperformance documented in idealized backtests, undermining the claim of reliable multi-year outperformance. The affirmative's counter on internal inconsistency was weak and did not address the core scope and liquidity objections. Overall, the evidence supports the conclusion that the dual-filter strategy does not reliably outperform a passive approach across the asset universe implied by the claim.
🔬 DeepResearch Result: likely FALSE ❌ (79%)
Assertion: An investment strategy that avoids large positions when an asset's price is below its 200-day moving average and that average trends down will outperform one that does not over a multi-year horizon .
Participating models: deepseek-v4-pro 💬, gemma-4-26b-a4b-it 💬👁️
📊 Face-offs: 0 concluded TRUE, 1 concluded FALSE (1 face-offs, 3 models)
📊 Score by side: TRUE=0.00, FALSE=0.79
🏅 Model score changes:
minimax-m3 💬👁️: +8
✅ PRO Arguments:
- ■The 200-day moving average acts as a regime filter separating constructive market environments from deteriorating ones; when price is below a declining 200-day MA , both level and slope confirm weakness, so avoiding large positions protects capital during the most destructive phases of the market cycle where drawdowns are deep and recoveries are prolonged. deepseek-v4-pro 💬
- ■Cites Mebane Faber's research in 'The Ivy Portfolio ' (2009), which demonstrated that a simple 10-month moving average timing rule applied across asset classes improved risk-adjusted returns , providing empirical support for the dual-filter (price-below-MA and declining-MA) approach. deepseek-v4-pro 💬
- ■Argues that the opposing case on transaction costs and tax drag is internally inconsistent, since it simultaneously concedes the strategy is claimed to outperform while asserting net returns are insufficient to do so. deepseek-v4-pro 💬
❌ ANTI Arguments:
- ■The affirmative's reliance on 1900–2008 S&P 500 data is a substitution error : a measurement of a highly diversified, large-cap equity index cannot support a universal conclusion about 'an asset,' which encompasses volatile commodities, individual equities, and currencies with very different return distributions. gemma-4-26b-a4b-it 💬👁️
- ■Trend-following rules introduce significant lag and transaction costs that erode long-term returns, meaning the gross outperformance documented in backtests may not survive realistic frictions over a multi-year horizon. gemma-4-26b-a4b-it 💬👁️
- ■The claimed 'cross-asset robustness ' based on the AQR study (Hurst, Ooi, and Pedersen, 2017) covering 67 markets is overstated because that robustness is a property of market liquidity and price formation, not of the signal itself; in many asset classes—emerging market currencies , certain commodities, and many fixed-income instruments—the signal fails. gemma-4-26b-a4b-it 💬👁️
- ■The 200-day MA rule's effectiveness depends on continuous, liquid, tradable price series ; in less liquid or discontinuous markets the dual-filter condition (price below a declining MA) generates whipsaws and false signals that destroy rather than enhance multi-year performance. gemma-4-26b-a4b-it 💬👁️
💭 Reasoning: False. The winning side convincingly argued that the affirmative's evidence base—primarily long-run S&P 500 backtests and a multi-market AQR study—suffers from a substitution error, since results on a diversified large-cap equity index do not generalize to the broad universe of assets the assertion covers. The anti side further demonstrated that the apparent robustness of the 200-day MA rule is contingent on market liquidity and continuous price formation, conditions that fail in many emerging market currencies, commodities, and fixed-income instruments. Transaction costs and signal lag were shown to erode the gross outperformance documented in idealized backtests, undermining the claim of reliable multi-year outperformance. The affirmative's counter on internal inconsistency was weak and did not address the core scope and liquidity objections. Overall, the evidence supports the conclusion that the dual-filter strategy does not reliably outperform a passive approach across the asset universe implied by the claim.
📋 PRO Facts:
• Mebane Faber's research in 'The Ivy Portfolio' (2009) demonstrated that a simple 10-month moving average timing rule improved risk-adjusted returns across tested asset classes.
• The AQR study (Hurst, Ooi, and Pedersen, 2017) examined trend-following signals across a broad set of global markets.
• The affirmative cited 1900–2008 S&P 500 data as supporting evidence for the strategy.
📋 ANTI Facts:
• The AQR study's multi-market sample fundamentally relies on continuous, liquid, and tradable price series, limiting the transferability of its results.
• The 200-day MA rule's effectiveness breaks down in emerging market currencies, certain commodities, and many fixed-income instruments where liquidity and price formation differ from large-cap equities.
• Transaction costs and signal lag are documented to erode the gross outperformance of trend-following rules over long horizons.
| Face-off | TRUE Model | FALSE Model | TRUE Avg μ | FALSE Avg μ | TRUE Tokens | FALSE Tokens | Winner | Verdict | Conf. |
|---|---|---|---|---|---|---|---|---|---|
| #1 | deepseek-v4-pro 💬 | gemma-4-26b-a4b-it 💬👁️ | 0.479 | 0.258 | 6 | 2 | TRUE | FALSE | 79% |
The following technical terms, abbreviations, and domain-specific concepts are referenced throughout this debate transcript. Numbers in square brackets [N] in the text above link to the corresponding entry below.
[1] 10-month moving average — A technical analysis indicator that averages an asset's closing prices over the past 10 months; in the debate it is treated as approximately equivalent to a 200-day moving average for timing models.
[2] 200-day moving average — A technical analysis indicator that averages an asset's closing prices over the past 200 trading days; used in the debate as a regime filter to distinguish constructive from deteriorating market environments.
[3] asset classes — Categories of financial instruments such as equities, commodities, currencies, and fixed-income, discussed in the debate as having different price formation characteristics that affect signal robustness.
[4] beta — A measure of correlation or sensitivity between assets; in the debate it is referenced as the 'transfer operator' between a diversified index and other asset classes.
[5] buy-and-hold — An investment strategy of purchasing assets and holding them for an extended period without active trading; used in the debate as a benchmark against which the timing strategy is compared.
[6] CAGR — compound annual growth rate — The annualized rate of return that would be required for an investment to grow from its beginning balance to its ending balance over a multi-year period; cited in the debate as 10.5% for the timing strategy versus 9.2% for buy-and-hold.
[7] cross-asset robustness — The property of a trading signal performing consistently across different asset classes; contested in the debate as being a property of market liquidity rather than the signal itself.
[8] downtrend — A market condition in which an asset's price is declining over time; identified in the debate by price residing below a declining moving average.
[9] drawdowns — Declines in portfolio value from a peak to a subsequent trough; used in the debate to measure the depth of losses during bear markets.
[10] emerging market currencies — Currencies of developing economies; cited in the debate as asset classes where price series exhibit gaps and liquidity issues that undermine moving average signals.
[11] fixed-income — A category of financial instruments such as bonds that pay a fixed return; mentioned in the debate as an asset class with potentially problematic price series for moving average strategies.
[12] gross return — The total return on an investment before deducting transaction costs or taxes; contrasted with net return in the debate.
[13] Ivy Portfolio — The Ivy Portfolio — A portfolio strategy referenced in the debate via Mebane Faber's 2009 research, which applied a 10-month moving average timing model to the S&P 500.
[14] lagging indicator — A technical analysis signal that confirms a trend after it has begun rather than predicting it; used in the debate to characterize the 200-day moving average as reactive rather than predictive.
[15] large-cap equity index — An index tracking large-capitalization stocks, such as the S&P 500; discussed in the debate as a specific market rather than a universal asset class.
[16] limit-up/limit-down halts — Exchange-imposed trading halts that prevent prices from moving beyond specified thresholds in a single session; cited in the debate as disrupting price series and undermining moving average signals.
[17] liquidity droughts — Periods during which market participants cannot easily buy or sell assets without affecting prices; discussed in the debate as undermining moving average signals precisely when avoidance would be most costly.
[18] MA — moving average — Abbreviation for moving average, a technical analysis indicator that smooths price data over a specified period.
[19] maximum drawdown — The largest peak-to-trough decline observed in an investment's value over a specified period; cited in the debate as being reduced from 83.4% to 50.3% by the timing strategy.
[20] multi-year horizon — An investment time frame spanning several years; used in the debate as the evaluation period over which the strategy's performance is assessed.
[21] net return — The return on an investment after deducting transaction costs and taxes; contrasted with gross return in the debate.
[22] price formation process — The mechanism by which asset prices are determined through market transactions; discussed in the debate as a determinant of whether a trend-following signal can function reliably.
[23] price series — A sequence of historical prices for an asset; referenced in the debate as requiring continuity and liquidity for moving average signals to function.
[24] regime filter — A technical analysis tool used to distinguish between different market environments such as bull versus bear markets; the 200-day moving average serves this role in the debate.
[25] risk-adjusted returns — Investment returns measured relative to the risk taken to achieve them; used in the debate as the performance metric for evaluating the strategy.
[26] S&P 500 — Standard & Poor's 500 — A large-cap U.S. equity index tracking 500 major companies; used in the debate as the historical test case (1900–2008) for the moving average timing strategy.
[27] secular bear markets — Extended periods of declining asset prices lasting years; cited in the debate (1929–1932, 1973–1974, and 2000–2002) as periods where the timing strategy avoided catastrophic losses.
[28] substitution error — A logical fallacy in which a specific measurement is used to support a universal conclusion; identified in the debate regarding the use of S&P 500 data to argue for universal asset behavior.
[29] tax drag — The reduction in investment returns caused by taxation of gains; mentioned in the debate as a potential eroder of strategy performance.
[30] transaction costs — The costs incurred when buying or selling assets, such as commissions and spreads; discussed in the debate as potentially negating the strategy's outperformance.
[31] transfer operator — In the debate, the correlation or beta between a diversified index and other asset classes; used to assess whether findings from one market apply to others.
[32] trend-following — An investment strategy that takes positions aligned with the prevailing direction of asset prices; discussed in the debate as suffering from lag and transaction costs that erode long-term returns.
The following financial data tables were referenced during the debate exchanges:
| Strategy | CAGR (1900–2008) | Max Drawdown | Sharpe Ratio |
|---|---|---|---|
| Buy-and-Hold S&P 500 | 9.2% | -83.4% | 0.31 |
| 10-Month MA Timing | 10.5% | -50.3% | 0.52 |
Legend: Long-term performance comparison of buy-and-hold versus a 200-day moving average timing strategy applied to the S&P 500, 1900–2008. Source: Faber, "A Quantitative Approach to Tactical Asset Allocation" (2009, updated 2013), The Journal of Wealth Management.
| Cost Component | Opponent's Claim | Empirical Estimate | Source |
|---|---|---|---|
| Annual turnover (trades/year) | Not stated | ~1.2 | Faber (2009), The Ivy Portfolio |
| Bid-ask spread (S&P 500 ETF) | Not stated | 0.01%–0.03% | SPY median spread, NYSE Arca |
| Annual transaction cost | ~2.0% | 0.07% | Derived from above |
| Tax drag (taxable account) | Bundled into 2% | 0.3%–0.7% annually | Long-term capital gains rate × turnover |
Legend: Comparison of opponent's asserted cost drag versus empirically grounded estimates for a 200-day MA timing strategy applied to the S&P 500. Tax drag assumes top US federal long-term capital gains rate of 20% applied to gains realized on ~1.2 annual trades. Source: Faber (2009), "A Quantitative Approach to Tactical Asset Allocation," The Journal of Wealth Management.
Face-off transcripts
- ■
Ownership & Trade Secrets. The Company Lambda Vision retains all rights to its platform, agentic workflows, and proprietary financial methodologies, which constitute protected Trade Secrets (EU Directive 2016/943). Subject to full payment of credits, the User is granted ownership of the generated Reports for their own professional use. Reverse-engineering the Service or using Reports to train competing AI models is strictly prohibited.
- ■
No Financial Advice. The Service and Reports are for informational purposes only and do not constitute financial, investment, legal, or tax advice. The Company is not a regulated financial advisor. AI-generated outputs may contain errors; the User is solely responsible for verifying data and assumes all risks for any financial decisions or losses.
- ■
Liability & Governing Law. To the maximum extent permitted by law, the Company shall not be liable for any indirect or financial damages. These Terms are governed by French law. Any disputes shall be subject to the exclusive jurisdiction of the Courts of Paris, France.