
An investor who compounds at 20% annually for ten years matches the performance of the world's best investors.
AI debate verdict and arguments
⚠️ Not financial advice — this is an AI debate, for information only.
Completed October 29, 2026
Verdict
Verdict: likely FALSE (90%)
This section provides a brief overview of the key arguments. You do not need to read the full detailed report below.
✅ Key PRO arguments:
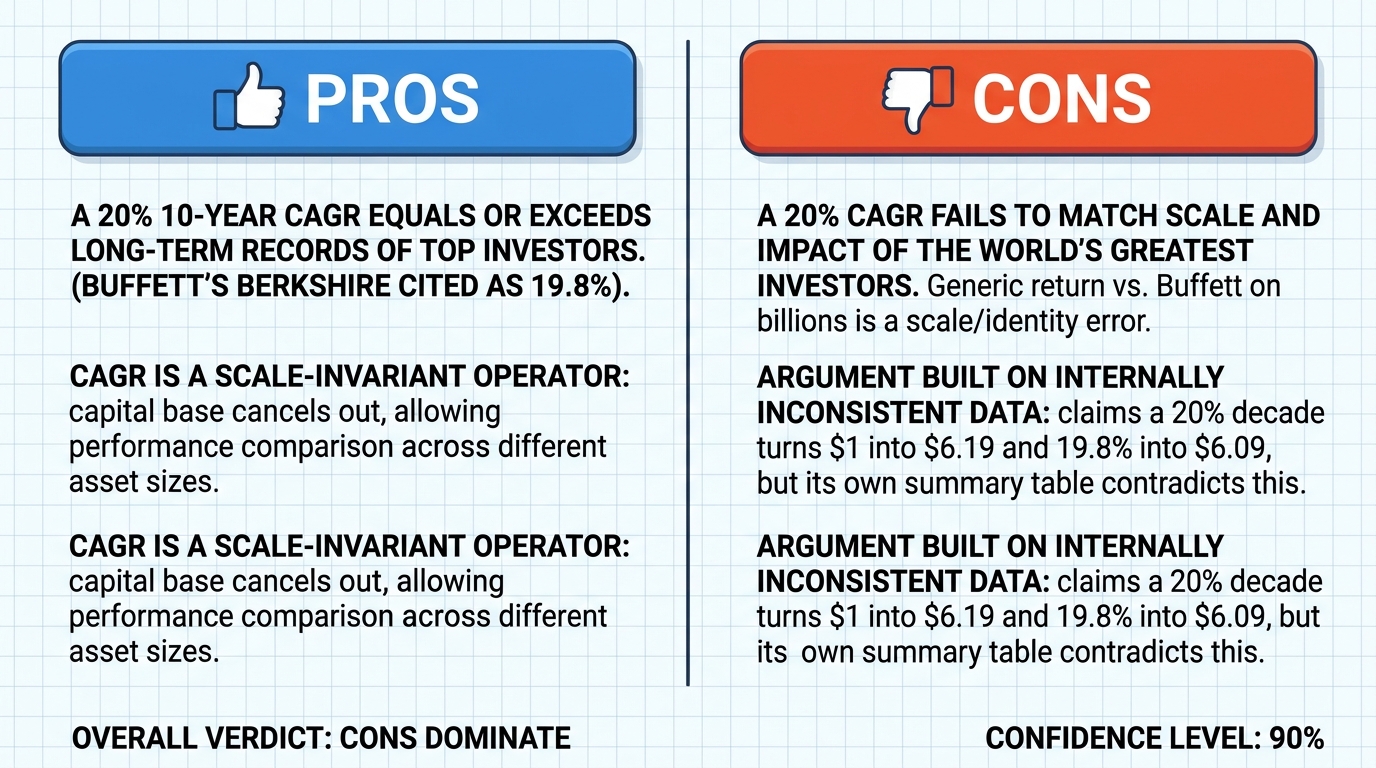
- ■A 20% ten-year CAGR equals or exceeds the long-term records of history's greatest investors. Buffett's Berkshire Hathaway delivered a compound annual gain of 19.8% from 1965 through 2023; a 20% rate over a decade is arithmetically indistinguishable, with $1 growing to $6.19 vs $6.09 at 19.8%, a terminal difference of only 1.68%.
- ■CAGR is by definition a scale-invariant transfer operator : (Ending Value / Beginning Value)^(1/n) - 1, so the capital base cancels out and performance across different capital bases is directly comparable.
❌ Key ANTI arguments:
- ■A 20% CAGR fails to match the scale and impact of the world's greatest investors. Comparing a generic 20% return to Buffett's 19.8% is a scale and identity error; a 20% return on $1 million is a personal success, while a 19.8% return on hundreds of billions is a structural phenomenon.
- ■The affirmative's argument is built on internally inconsistent data: it claims a 20% decade turns $1 into $6.19 and 19.8% into $6.09, but its own summary table lists different 10-year growth figures, so the comparison lacks a stable measurement.
💭 Conclusion: False: the winning side successfully showed that a 20% CAGR does not match the performance of the world's best investors. The negative's strongest argument was that comparing a generic 20% return to Buffett's 19.8% CAGR on hundreds of billions of dollars is a scale and identity error, requiring a transfer operator such as correlation or beta . The negative also exposed an internal inconsistency in the affirmative's own numerical example, undermining the claim that the two rates are arithmetically indistinguishable. The affirmative's rebuttal that CAGR is scale-invariant did not overcome the judge's assessment that the comparison fails on scale and identity. Therefore the verdict is FALSE with 90% confidence.
🔬 DeepResearch Result: likely FALSE ❌ (90%)
Assertion: An investor who compounds at 20% annually for ten years matches the performance of the world's best investors.
Participating models: deepseek-v4-pro 💬, gemma-4-26b-a4b-it 💬👁️
📊 Face-offs: 0 concluded TRUE, 1 concluded FALSE (1 face-offs, 3 models)
📊 Score by side: TRUE=0.00, FALSE=0.90
🏅 Model score changes:
deepseek-v4-flash-0731 💬: +9
✅ PRO Arguments:
- ■A 20% ten-year CAGR equals or exceeds the long-term records of history's greatest investors. Buffett's Berkshire Hathaway delivered a compound annual gain of 19.8% from 1965 through 2023; a 20% rate over a decade is arithmetically indistinguishable, with $1 growing to $6.19 vs $6.09 at 19.8%, a terminal difference of only 1.68%. deepseek-v4-pro 💬
- ■CAGR is by definition a scale-invariant transfer operator : (Ending Value / Beginning Value)^(1/n) - 1, so the capital base cancels out and performance across different capital bases is directly comparable. deepseek-v4-pro 💬
❌ ANTI Arguments:
- ■A 20% CAGR fails to match the scale and impact of the world's greatest investors. Comparing a generic 20% return to Buffett's 19.8% is a scale and identity error; a 20% return on $1 million is a personal success, while a 19.8% return on hundreds of billions is a structural phenomenon. gemma-4-26b-a4b-it 💬👁️
- ■The affirmative's argument is built on internally inconsistent data: it claims a 20% decade turns $1 into $6.19 and 19.8% into $6.09, but its own summary table lists different 10-year growth figures, so the comparison lacks a stable measurement. gemma-4-26b-a4b-it 💬👁️
💭 Reasoning: False: the winning side successfully showed that a 20% CAGR does not match the performance of the world's best investors. The negative's strongest argument was that comparing a generic 20% return to Buffett's 19.8% CAGR on hundreds of billions of dollars is a scale and identity error, requiring a transfer operator such as correlation or beta . The negative also exposed an internal inconsistency in the affirmative's own numerical example, undermining the claim that the two rates are arithmetically indistinguishable. The affirmative's rebuttal that CAGR is scale-invariant did not overcome the judge's assessment that the comparison fails on scale and identity. Therefore the verdict is FALSE with 90% confidence.
📋 PRO Facts:
• Berkshire Hathaway delivered a compound annual gain in per-share market value of 19.8% from 1965 through 2023.
• The S&P 500 compounded at 9.9% including dividends over the same period.
• $1 compounded at 19.8% for ten years becomes $6.09, while at 20% it becomes $6.19, a terminal difference of 1.68%.
• CAGR is computed as (Ending Value / Beginning Value)^(1/n) - 1.
📋 ANTI Facts:
• The negative argued that a 20% return on $1 million is a personal success, while a 19.8% return on hundreds of billions is a structural phenomenon.
• The negative argued that a transfer operator such as correlation or beta is needed to relate a generic 20% return to Berkshire's massive capital allocation.
• The negative argued that the affirmative's data is internally inconsistent and fails to provide a stable measurement.
| Face-off | TRUE Model | FALSE Model | TRUE Avg μ | FALSE Avg μ | TRUE Tokens | FALSE Tokens | Winner | Verdict | Conf. |
|---|---|---|---|---|---|---|---|---|---|
| #1 | deepseek-v4-pro 💬 | gemma-4-26b-a4b-it 💬👁️ | 0.614 | 0.224 | 6 | 2 | TRUE | FALSE | 90% |
The following technical terms, abbreviations, and domain-specific concepts are referenced throughout this debate transcript. Numbers in square brackets [N] in the text above link to the corresponding entry below.
[1] annualized growth rate — The average yearly growth rate of an investment over a period; used in the debate as equivalent to CAGR.
[2] assets under management — The total value of assets managed by an investor or firm; the negative side argues maintaining a high CAGR becomes harder as assets under management grow.
[3] benchmark — A reference point against which investment performance is compared; Buffett's 19.8% CAGR is described as the benchmark that defines world-class investing.
[4] beta — A financial measure of co-movement between an investment and a benchmark; the negative side suggests it as a possible transfer operator.
[5] CAGR — compound annual growth rate — A measure of an investment's annualized return over a period, computed as (Ending Value / Beginning Value)^(1/n) – 1. The debate uses it to compare returns across different capital bases.
[6] capital allocator — A person or entity responsible for deciding how capital is invested; Buffett is described as the greatest capital allocator in modern history.
[7] capital base — The amount of capital invested or managed; the debate discusses whether returns on different capital bases are comparable.
[8] co-movement — The tendency of two return streams to move together; correlation and beta are described as measuring co-movement.
[9] compound annual gain — The annualized rate at which an investment grows over a period; the transcript uses it for Berkshire Hathaway's 19.8% per-share market value gain.
[10] conglomerate — A large corporation made up of diverse businesses; Berkshire Hathaway is described as a $900 billion conglomerate.
[11] correlation — A statistical measure of co-movement between two return streams; the affirmative argues it is irrelevant to whether one annualized growth rate matches another.
[12] covariance metric — A statistical measure of how two variables move together; the affirmative classifies correlation and beta as covariance metrics.
[13] dividends — Payments to shareholders; the transcript notes the S&P 500 return is measured including dividends.
[14] investable universe — The set of assets available for investment; the negative side argues its size limits the ability to maintain high returns.
[15] liquidity constraints — Limitations on buying or selling assets without affecting prices; the negative side cites them as a reason high returns become harder at large scale.
[16] market impact — The effect of large trades or capital deployment on market prices; the negative side argues it constrains large investors.
[17] normalization metric — A measure that adjusts values to make comparison across different scales possible; the affirmative argues CAGR is a normalization metric.
[18] per-share market value — The market value of a single share; Berkshire Hathaway's compound annual gain in per-share market value was 19.8% from 1965 through 2023.
[19] portfolio — A collection of investments held by an investor; the affirmative says CAGR makes a $100,000 portfolio comparable to a $900 billion conglomerate.
[20] return streams — The sequences of returns generated by investments over time; the debate discusses correlation and beta as measures of co-movement between return streams.
[21] S&P 500 — Standard & Poor's 500 — The stock market index cited in the debate as a benchmark; the transcript states it compounded at 9.9% including dividends from 1965 through 2023.
[22] scale invariance — The property of a measure being unaffected by the size of the capital base; the affirmative claims CAGR is scale-invariant because the capital base cancels out in its formula.
[23] terminal difference — The difference between ending values after a period; the transcript cites a 1.68% terminal difference between $6.09 and $6.19 after ten years.
[24] transfer operator — A mathematical function that relates one quantity to another; the negative side argues a transfer operator such as correlation or beta is needed to compare returns across scales.
The following financial data tables were referenced during the debate exchanges:
| Metric | Berkshire Hathaway (1965–2023) | 20% Investor (10 Years) | S&P 500 (1965–2023) |
|---|---|---|---|
| Annual CAGR | 19.8% | 20.0% | 9.9% |
| $1 Grows To (10 yr) | $6.09 | $6.19 | $2.57 |
| Years Tracked | 58 | 10 | 58 |
Legend: Comparison of long-term compounding records. Berkshire Hathaway per-share market value CAGR from 1965–2023 per the 2023 Chairman's Letter. The 20% investor column shows the terminal value of $1 compounded at 20% for ten years. S&P 500 includes dividends reinvested.
| Investor / Fund | Approx. Tenure | Net CAGR | $1 Grows To (10 yr) |
|---|---|---|---|
| Buffett (Berkshire) | 1965–2023 | 19.8% | $6.09 |
| Swensen (Yale) | 1985–2020 | 16.3% | $4.53 |
| Medallion (Renaissance) | 1988–2018 | ~39% | $27.04 |
| 20% Investor | 10 years | 20.0% | $6.19 |
| S&P 500 | Long-term | ~10% | $2.59 |
Legend: Net annualized returns of iconic investors and benchmarks. Medallion figure from Zuckerman, The Man Who Solved the Market (2019), reflecting approximate net after fees. Yale figure from Yale Investments Office.
| Investor/Benchmark | Scale/Context | Primary Constraint | Performance Type |
|---|---|---|---|
| Generic 20% Investor | Small/Arbitrary | Liquidity/Capacity | Theoretical |
| Warren Buffett | Multi-Billion USD | Market Impact/Size | Structural |
| Renaissance Medallion | High Frequency/Small Cap | Capacity/Scalability | Algorithmic |
| S&P 500 | Global Market Cap | Macroeconomic Cycles | Benchmark |
Legend: Comparison of the qualitative constraints faced by different tiers of investors. The "Generic Investor" lacks the scale to be compared to institutional giants, while Buffett and Medallion face extreme capacity constraints.
Face-off transcripts
- ■
Ownership & Trade Secrets. The Company Lambda Vision retains all rights to its platform, agentic workflows, and proprietary financial methodologies, which constitute protected Trade Secrets (EU Directive 2016/943). Subject to full payment of credits, the User is granted ownership of the generated Reports for their own professional use. Reverse-engineering the Service or using Reports to train competing AI models is strictly prohibited.
- ■
No Financial Advice. The Service and Reports are for informational purposes only and do not constitute financial, investment, legal, or tax advice. The Company is not a regulated financial advisor. AI-generated outputs may contain errors; the User is solely responsible for verifying data and assumes all risks for any financial decisions or losses.
- ■
Liability & Governing Law. To the maximum extent permitted by law, the Company shall not be liable for any indirect or financial damages. These Terms are governed by French law. Any disputes shall be subject to the exclusive jurisdiction of the Courts of Paris, France.