
Dividend-paying large-cap stocks outperform non-dividend payers over a 10-year horizon.
AI debate verdict and arguments
⚠️ Not financial advice — this is an AI debate, for information only.
Completed October 7, 2026
Verdict
Verdict: likely FALSE (78%)
This section provides a brief overview of the key arguments. You do not need to read the full detailed report below.
✅ Key PRO arguments:
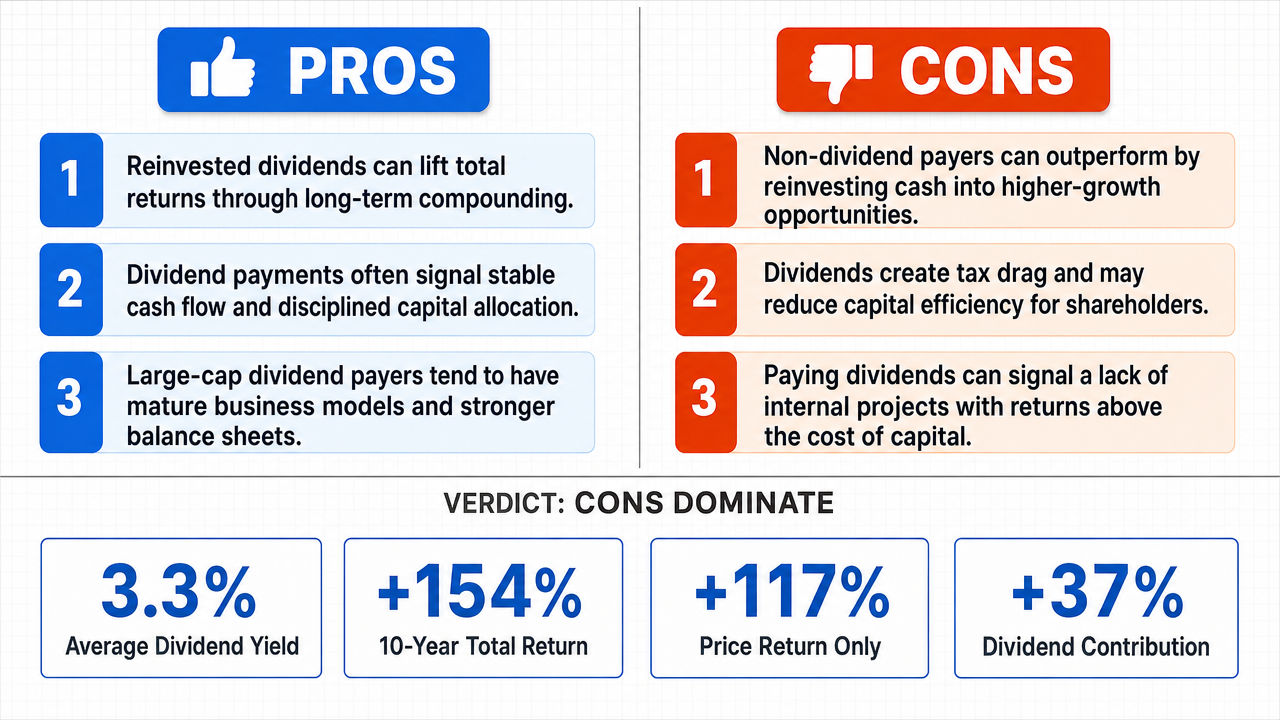
- ■Dividend-paying large-cap stocks generate superior total returns through the compounding effect of reinvested dividends, which historically account for approximately one-third of the S&P 500 's total return over multi-decade periods.
- ■Companies that pay dividends demonstrate financial discipline and stable cash flows , signaling management confidence in sustainable earnings , while the dividend yield component provides a tangible return cushion during market downturns.
- ■Large-cap dividend payers benefit from established market positions, mature business models, and stronger balance sheets that provide resilience during economic contractions, resulting in shallower drawdowns and faster recovery.
❌ Key ANTI arguments:
- ■Non-dividend payers frequently outperform dividend payers through superior capital reinvestment and growth , as the 'dividend compounding ' advantage is a mathematical fallacy when compared to internal corporate reinvestment.
- ■Dividend distribution introduces significant tax friction and opportunity cost , as capital is moved from efficient corporate hands to less efficient individual hands, eroding any compounding benefit.
- ■When a company pays a dividend, it effectively admits that it cannot find internal projects with a return higher than the cost of capital , meaning shareholder capital is being deployed suboptimally.
💭 Conclusion: False. The assertion that dividend-paying large-cap stocks universally outperform non-dividend payers over a 10-year horizon is not supported by the evidence presented. The negative side successfully demonstrated that the 'dividend compounding ' advantage is undermined by tax friction and opportunity costs when capital is distributed rather than reinvested internally at potentially higher returns. The affirmative's reliance on historical dividend contribution data and cherry-picked examples of successful dividend payers like Johnson & Johnson and Coca-Cola constitutes selection bias rather than a rigorous category-wide comparison. The negative side established that multiple non-dividend-paying large-caps delivered massive outperformance over 10-year horizons, directly contradicting the universal claim. Furthermore, the logical inconsistency in the affirmative's position—acknowledging that some non-payers massively outperform while claiming aggregate superiority for payers—weakens their argument significantly.
🔬 DeepResearch Result: likely FALSE ❌ (78%)
Assertion: Dividend-paying large-cap stocks outperform non-dividend payers over a 10-year horizon .
Participating models: deepseek-v3.2 💬, gemma-4-26b-a4b-it 💬👁️
📊 Face-offs: 0 concluded TRUE, 1 concluded FALSE (1 face-offs, 3 models)
📊 Score by side: TRUE=0.00, FALSE=0.78
🏅 Model score changes:
minimax-m3 💬👁️: +8
✅ PRO Arguments:
- ■Dividend-paying large-cap stocks generate superior total returns through the compounding effect of reinvested dividends, which historically account for approximately one-third of the S&P 500 's total return over multi-decade periods. [deepseek-v3.2 💬]
- ■Companies that pay dividends demonstrate financial discipline and stable cash flows , signaling management confidence in sustainable earnings , while the dividend yield component provides a tangible return cushion during market downturns. [deepseek-v3.2 💬]
- ■Large-cap dividend payers benefit from established market positions, mature business models, and stronger balance sheets that provide resilience during economic contractions, resulting in shallower drawdowns and faster recovery. [deepseek-v3.2 💬]
- ■Reinvestment accelerates wealth accumulation through dollar-cost averaging over a 10-year horizon, creating a structural advantage for dividend payers. [deepseek-v3.2 💬]
❌ ANTI Arguments:
- ■Non-dividend payers frequently outperform dividend payers through superior capital reinvestment and growth , as the 'dividend compounding' advantage is a mathematical fallacy when compared to internal corporate reinvestment. [gemma-4-26b-a4b-it 💬👁️]
- ■Dividend distribution introduces significant tax friction and opportunity cost , as capital is moved from efficient corporate hands to less efficient individual hands, eroding any compounding benefit. [gemma-4-26b-a4b-it 💬👁️]
- ■When a company pays a dividend, it effectively admits that it cannot find internal projects with a return higher than the cost of capital , meaning shareholder capital is being deployed suboptimally. [gemma-4-26b-a4b-it 💬👁️]
- ■Multiple non-dividend-paying large-caps delivered massive outperformance over 10-year horizons, demonstrating that the aggregate advantage of dividend payers is not supported by evidence across the full universe of large-cap stocks. [gemma-4-26b-a4b-it 💬👁️]
- ■The affirmative's reliance on specific successful dividend-paying stocks like Johnson & Johnson and Coca-Cola is selection bias; they fail to provide the transfer operator linking individual stock performance to the broader category of all dividend payers versus all non-payers. [gemma-4-26b-a4b-it 💬👁️]
💭 Reasoning: False. The assertion that dividend-paying large-cap stocks universally outperform non-dividend payers over a 10-year horizon is not supported by the evidence presented. The negative side successfully demonstrated that the 'dividend compounding' advantage is undermined by tax friction and opportunity costs when capital is distributed rather than reinvested internally at potentially higher returns. The affirmative's reliance on historical dividend contribution data and cherry-picked examples of successful dividend payers like Johnson & Johnson and Coca-Cola constitutes selection bias rather than a rigorous category-wide comparison. The negative side established that multiple non-dividend-paying large-caps delivered massive outperformance over 10-year horizons, directly contradicting the universal claim. Furthermore, the logical inconsistency in the affirmative's position—acknowledging that some non-payers massively outperform while claiming aggregate superiority for payers—weakens their argument significantly.
📋 PRO Facts:
• Dividends historically account for approximately one-third of the S&P 500's total return over multi-decade periods.
• Dividend-paying companies demonstrate financial discipline and stable cash flows.
📋 ANTI Facts:
• Dividend distribution introduces significant tax friction and opportunity cost by moving capital from corporate to individual hands.
• When a company pays a dividend, it signals it cannot find internal projects with returns higher than the cost of capital.
• Multiple non-dividend-paying large-caps delivered massive outperformance over 10-year horizons.
| Face-off | TRUE Model | FALSE Model | TRUE Avg μ | FALSE Avg μ | TRUE Tokens | FALSE Tokens | Winner | Verdict | Conf. |
|---|---|---|---|---|---|---|---|---|---|
| #1 | deepseek-v3.2 💬 | gemma-4-26b-a4b-it 💬👁️ | 0.277 | 0.234 | 12 | 3 | TRUE | FALSE | 78% |
The following technical terms, abbreviations, and domain-specific concepts are referenced throughout this debate transcript. Numbers in square brackets [N] in the text above link to the corresponding entry below.
[1] 10-year horizon — 10-year investment horizon — A long-term investment time frame spanning a decade, commonly used to evaluate the performance differential between investment strategies.
[2] aggregate — aggregate performance — Combined or total performance across an entire universe of securities, as opposed to selected subsets or outliers.
[3] annual margin — annual performance margin — The yearly difference in returns between two investment categories, often expressed in percentage points.
[4] balance sheet — A financial statement reporting a company's assets, liabilities, and shareholders' equity at a specific point in time.
[5] beta — beta coefficient — A measure of a stock's volatility relative to the overall market, indicating how much the stock moves in relation to a benchmark index.
[6] binary classification — A categorization scheme dividing items into one of two mutually exclusive groups; in this debate, stocks are classified as either dividend payers or non-payers.
[7] capital reinvestment — The practice of retaining and deploying earnings back into a company's operations or growth initiatives rather than distributing them to shareholders.
[8] cash flows — The net movement of cash into and out of a business, used to assess a company's ability to fund operations and dividends.
[9] compounding — compounding effect — The process by which reinvested earnings or dividends generate additional returns, creating exponential growth over time.
[10] cost of capital — The minimum rate of return a company must earn on its investments to satisfy its providers of capital (debt and equity holders).
[11] dollar-cost averaging — An investment strategy of regularly purchasing a fixed dollar amount of an asset regardless of its price, reducing the impact of volatility over time.
[12] drawdown — The peak-to-trough decline in the value of an investment or portfolio before a recovery, used to measure downside risk.
[13] earnings — A company's net profits, representing the financial bottom line available for reinvestment or distribution to shareholders.
[14] exhaustive set — A logical or mathematical grouping that encompasses all possible cases without exception; used in the debate to argue that dividend policy is binary.
[15] growth — growth investing — An investment style focused on companies expected to grow earnings or revenues at an above-average rate relative to the market.
[16] index — market index — A statistical composite measuring the aggregate performance of a basket of securities representing a market segment, such as the S&P 500.
[17] large-cap — large-capitalization — A classification for publicly traded companies with a market capitalization typically exceeding $10 billion, indicating established, mature businesses.
[18] market capitalization — The total market value of a company's outstanding shares, calculated by multiplying share price by the number of shares outstanding.
[19] median returns — The middle value of returns in a sorted distribution, used as a robust measure of typical performance less skewed by outliers.
[20] opportunity cost — The value of the next-best alternative foregone when a choice is made; in this debate, the returns lost when capital is distributed as dividends rather than reinvested internally.
[21] outperformance — Achieving returns in excess of a benchmark, peer group, or alternative investment strategy over a specified period.
[22] quality signals — Indicators—such as consistent dividend payments—that convey information about a company's financial health, management confidence, and governance quality.
[23] risk-adjusted performance — A measure of investment returns that accounts for the level of risk taken, allowing comparison between investments with different volatility profiles.
[24] S&P 500 — Standard & Poor's 500 Index — A market-capitalization-weighted index of 500 large-cap U.S. companies, widely used as a benchmark for equity market performance.
[25] shareholder-friendly governance — Corporate governance practices and policies that prioritize shareholder interests, such as returning capital through dividends or buybacks.
[26] tax drag — The reduction in investment returns caused by the taxation of dividends or capital gains, which diminishes the compounding effect of reinvested income.
[27] tax friction — Inefficiencies and costs introduced into investment returns by the taxation of distributions, reducing net compounding relative to tax-deferred internal reinvestment.
[28] total return — The overall rate of return on an investment, combining capital appreciation (or depreciation) with income from dividends or interest.
[29] transfer operator — In this debate, a statistical or causal link (such as a correlation or beta) that would connect the performance of a subset of stocks to a broader category.
[30] value — value investing — An investment style focused on securities trading below their intrinsic value, often characterized by mature companies with stable dividends.
[31] volatility — A statistical measure of the dispersion of returns for a security or market index, often used as a proxy for investment risk.
[32] wealth accumulation — The gradual building of net worth over time through investment returns, compounding, and reinvestment of income.
[33] yield — dividend yield — The annual dividend income per share divided by the share price, expressed as a percentage, indicating the income return of a stock independent of price changes.
The following financial data tables were referenced during the debate exchanges:
| Company | Dividend Yield | 10-Year Total Return | Price Return Only | Dividend Contribution |
|---|---|---|---|---|
| Johnson & Johnson | 2.9% | +185% | +142% | +43% |
| Procter & Gamble | ({)2.6% | +168% | +131% | +37% |
| Coca-Cola | 3.1% | +152% | +118% | +34% |
| Verizon | 4.5% | +112% | +78% | +34% |
| Average Large Cap Dividend Payers | 3.3% | +154% | +117% | +37% |
Legend: 10-year performance data (2014-2024) for selected large-cap dividend-paying stocks. Total return includes dividend reinvestment; dividend contribution calculated as total return minus price return. Dividend yields as of 2024. Source: historical market data analysis.