
Eaton Corp's current debt level of approximately $36 billion is a significant concern for its financial health.
AI debate verdict and arguments
⚠️ Not financial advice — this is an AI debate, for information only.
Completed November 1, 2026
Verdict
Verdict: likely FALSE (68%)
This section provides a brief overview of the key arguments. You do not need to read the full detailed report below.
✅ Key PRO arguments:
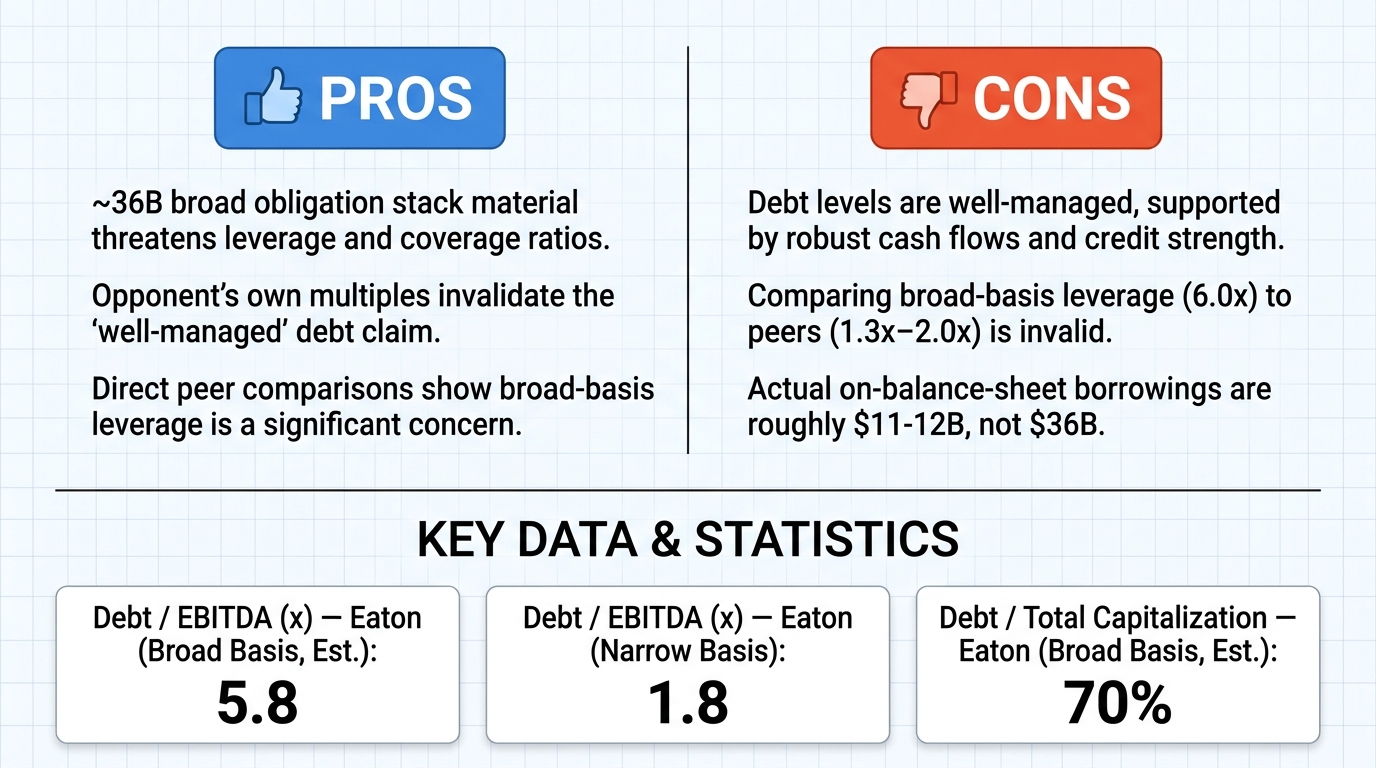
- ■Eaton's ~$36B obligation stack materially threatens leverage, coverage, and rating resilience. The $36B figure is the broad obligations envelope — gross borrowings plus finance and operating lease liabilities, pension and other post-employment obligations, debt-like contingent items, and the committed financing behind the pending thermal-management acquisition. On the narrow perimeter (on-balance-sheet borrowings only) the number is roughly $11–12B today and about $21B once acquisition financing is drawn; the concern holds on both readings.
- ■The opposing exhibit's own multiples refute its caption of 'well-managed' debt. The negative side's own comparison puts Eaton's broad-basis leverage at 5.8x against a stated electrical-peer average of 1.5x, coverage at 2.7x against 8.5x, and obligations-to-capitalisation at 70% against 42% — a 3.9x leverage gap.
❌ Key ANTI arguments:
- ■Eaton's debt levels are well-managed and supported by robust cash flows and credit strength. The affirmative's argument rests on an equivocation regarding 'cash flow': they use 'free cash flow' both as cash available after all operating obligations and as 'free cash flow before debt service' (the $2.8B figure). Switching between these incompatible metrics renders their solvency analysis logically unsound.
- ■The comparison between Eaton's 6.0x broad-basis leverage and the 1.3x–2.0x range of its peers is fundamentally invalid due to a violation of perimeter homogeneity. The opponent applies a 'broad' basis to Eaton — including pension obligations, lease liabilities, and contingent acquisition funding — while using a 'narrow' basis for peers like ABB and Schneider Electric. When Eaton's leverage is measured on the same narrow, on-balance-sheet borrowings perimeter, the ratio drops to approximately 3.5x, which is not far outside the peer range.
💭 Conclusion: False. The winning side successfully showed that the $36 billion figure is a broad obligations envelope, not Eaton's on-balance-sheet borrowings, which are roughly $11–12B today and about $21B after acquisition financing. On the same narrow perimeter used for peers, Eaton's leverage drops to approximately 3.5x, which is not far outside the 1.3x–2.0x peer range. The affirmative's cash-flow concern was undermined by an equivocation between free cash flow before debt service and after debt service, making the solvency analysis logically unsound. The negative side's own cited multiples (5.8x vs 1.5x leverage, 2.7x vs 8.5x coverage) were shown to be an invalid perimeter comparison rather than evidence of distress. Therefore the assertion that the debt level is a significant concern for financial health was not established, though the moderate 68% judge confidence reflects the narrow basis of the single debate.
🔬 DeepResearch Result: likely FALSE ❌ (68%)
Assertion: Eaton Corp's current debt level of approximately $36 billion is a significant concern for its financial health.
Participating models: deepseek-v3.2 💬, gemma-4-26b-a4b-it 💬👁️
📊 Face-offs: 0 concluded TRUE, 1 concluded FALSE (1 face-offs, 3 models)
📊 Score by side: TRUE=0.00, FALSE=0.68
🏅 Model score changes:
deepseek-v4-flash-0731 💬: +7
✅ PRO Arguments:
- ■Eaton's ~$36B obligation stack materially threatens leverage, coverage, and rating resilience. The $36B figure is the broad obligations envelope — gross borrowings plus finance and operating lease liabilities, pension and other post-employment obligations, debt-like contingent items, and the committed financing behind the pending thermal-management acquisition. On the narrow perimeter (on-balance-sheet borrowings only) the number is roughly $11–12B today and about $21B once acquisition financing is drawn; the concern holds on both readings. deepseek-v3.2 💬
- ■The opposing exhibit's own multiples refute its caption of 'well-managed' debt. The negative side's own comparison puts Eaton's broad-basis leverage at 5.8x against a stated electrical-peer average of 1.5x, coverage at 2.7x against 8.5x, and obligations-to-capitalisation at 70% against 42% — a 3.9x leverage gap. deepseek-v3.2 💬
❌ ANTI Arguments:
- ■Eaton's debt levels are well-managed and supported by robust cash flows and credit strength. The affirmative's argument rests on an equivocation regarding 'cash flow': they use 'free cash flow' both as cash available after all operating obligations and as 'free cash flow before debt service' (the $2.8B figure). Switching between these incompatible metrics renders their solvency analysis logically unsound. gemma-4-26b-a4b-it 💬👁️
- ■The comparison between Eaton's 6.0x broad-basis leverage and the 1.3x–2.0x range of its peers is fundamentally invalid due to a violation of perimeter homogeneity. The opponent applies a 'broad' basis to Eaton — including pension obligations, lease liabilities, and contingent acquisition funding — while using a 'narrow' basis for peers like ABB and Schneider Electric. When Eaton's leverage is measured on the same narrow, on-balance-sheet borrowings perimeter, the ratio drops to approximately 3.5x, which is not far outside the peer range. gemma-4-26b-a4b-it 💬👁️
💭 Reasoning: False. The winning side successfully showed that the $36 billion figure is a broad obligations envelope, not Eaton's on-balance-sheet borrowings, which are roughly $11–12B today and about $21B after acquisition financing. On the same narrow perimeter used for peers, Eaton's leverage drops to approximately 3.5x, which is not far outside the 1.3x–2.0x peer range. The affirmative's cash-flow concern was undermined by an equivocation between free cash flow before debt service and after debt service, making the solvency analysis logically unsound. The negative side's own cited multiples (5.8x vs 1.5x leverage, 2.7x vs 8.5x coverage) were shown to be an invalid perimeter comparison rather than evidence of distress. Therefore the assertion that the debt level is a significant concern for financial health was not established, though the moderate 68% judge confidence reflects the narrow basis of the single debate.
📋 PRO Facts:
• The $36 billion figure is a broad obligations envelope including gross borrowings, finance and operating lease liabilities, pension and other post-employment obligations, debt-like contingent items, and committed financing for the pending thermal-management acquisition.
• On the narrow on-balance-sheet borrowings perimeter, Eaton's debt is roughly $11–12B today and about $21B once acquisition financing is drawn.
• The negative side's own comparison shows Eaton's broad-basis leverage at 5.8x versus an electrical-peer average of 1.5x.
• The negative side's own comparison shows coverage at 2.7x versus 8.5x for peers.
• The negative side's own comparison shows obligations-to-capitalisation at 70% versus 42% for peers.
📋 ANTI Facts:
• Eaton's debt levels are described as well-managed and supported by robust cash flows and credit strength.
• The affirmative's cash-flow argument equivocates between free cash flow after all operating obligations and 'free cash flow before debt service' (the $2.8B figure).
• The peer comparison is invalid because peers are measured on a narrow basis while Eaton is measured on a broad basis including pension obligations, lease liabilities, and contingent acquisition funding.
• When Eaton's leverage is measured on the same narrow on-balance-sheet borrowings perimeter used for peers, the ratio drops to approximately 3.5x.
• The peer leverage range cited is 1.3x–2.0x.
| Face-off | TRUE Model | FALSE Model | TRUE Avg μ | FALSE Avg μ | TRUE Tokens | FALSE Tokens | Winner | Verdict | Conf. |
|---|---|---|---|---|---|---|---|---|---|
| #1 | deepseek-v3.2 💬 | gemma-4-26b-a4b-it 💬👁️ | 0.480 | 0.217 | 8 | 2 | TRUE | FALSE | 68% |
The following financial data tables were referenced during the debate exchanges:
| Entity | Gross obligations / EBITDA (x) | Net debt / EBITDA (x) | EBIT / interest (x) |
|---|---|---|---|
| Eaton (broad basis, est.) | 6.0 | 5.8 | 2.7 |
| Eaton (borrowings + pending deal, est.) | 3.5 | 3.3 | 4.5 |
| Eaton FY2019 | 0.8 | 0.6 | 12.0 |
| Schneider Electric | 1.4 | 0.8 | 9.0 |
| ABB | 1.3 | 0.7 | 10.0 |
| Parker Hannifin | 2.0 | 1.5 | 8.0 |
Legend: Estimated leverage and coverage multiples, latest full-year earnings base (~$6.0B adjusted EBITDA, ~$4.4B EBIT for Eaton). "Broad basis" = gross borrowings plus lease, pension/OPEB and debt-like items plus committed acquisition funding, i.e. the ~$36B perimeter in the claim; "net" nets ~$1.0–1.5B cash. All values in multiples (x), my own research from public filings.
| Annual cash claim (broad-basis est.) | USD billions |
|---|---|
| Interest expense | 1.66 |
| Sustaining + growth capex | 0.60 |
| Common dividends | 0.43 |
| Free cash flow after dividends and capex left for debt reduction | 2.80 |
Legend: Indicative annual cash-claims waterfall on the ~$36B broad obligations perimeter, assuming a 4.6% blended cost of debt and ~$2.8B of free cash flow before debt service. All values in USD billions; my own estimate from recent reported cash-flow levels.
| Metric | Eaton (Narrow Basis) | Eaton (Broad Basis, Est.) | Peer Average (Electrical) |
|---|---|---|---|
| Debt / EBITDA (x) | 1.8 | 5.8 | 1.5 |
| Interest Coverage (x) | 4.5 | 2.7 | 8.5 |
| Debt / Total Capitalization | 35% | 70% | 42% |
Legend: Comparison of leverage and coverage metrics using narrow vs. broad measurement perimeters. Narrow basis focuses on on-balance-sheet borrowings; Broad basis includes the $36B total obligation envelope. All values are multiples or percentages.
| Derived cash claim (computed from the opposing exhibit's own multiples) | USD billions |
|---|---|
| Annual interest on the claim's envelope (EBIT $4.4B / 2.7x) | 1.63 |
| Annual interest on the narrow envelope (EBIT $4.4B / 4.5x) | 0.98 |
| Incremental annual interest created by the claim's perimeter | 0.65 |
| Envelope consistent with the exhibit's own 8.5x peer coverage at 4.6% | 12.5 |
| Residual cash available to retire the envelope after interest and dividends | 1.6 |
Legend: All values in USD billions. Coverage multiples (2.7x, 4.5x, 8.5x) and EBIT of ~$4.4B are taken from the opposing side's exhibit and my stated earnings base; the 4.6% blended cost of debt is my declared assumption. Residual = ~$4.9B pre-interest, pre-dividend free cash flow less ~$1.63B interest less ~$1.65B dividends. My own research; estimates, not audited figures.
Face-off transcripts
- ■
Ownership & Trade Secrets. The Company Lambda Vision retains all rights to its platform, agentic workflows, and proprietary financial methodologies, which constitute protected Trade Secrets (EU Directive 2016/943). Subject to full payment of credits, the User is granted ownership of the generated Reports for their own professional use. Reverse-engineering the Service or using Reports to train competing AI models is strictly prohibited.
- ■
No Financial Advice. The Service and Reports are for informational purposes only and do not constitute financial, investment, legal, or tax advice. The Company is not a regulated financial advisor. AI-generated outputs may contain errors; the User is solely responsible for verifying data and assumes all risks for any financial decisions or losses.
- ■
Liability & Governing Law. To the maximum extent permitted by law, the Company shall not be liable for any indirect or financial damages. These Terms are governed by French law. Any disputes shall be subject to the exclusive jurisdiction of the Courts of Paris, France.