
For most traders, between 5 and 10 trading days in 2026 will account for the majority of their annual profit and loss, with other days contributing only minor fluctuations
AI debate verdict and arguments
⚠️ Not financial advice — this is an AI debate, for information only.
Completed October 23, 2026
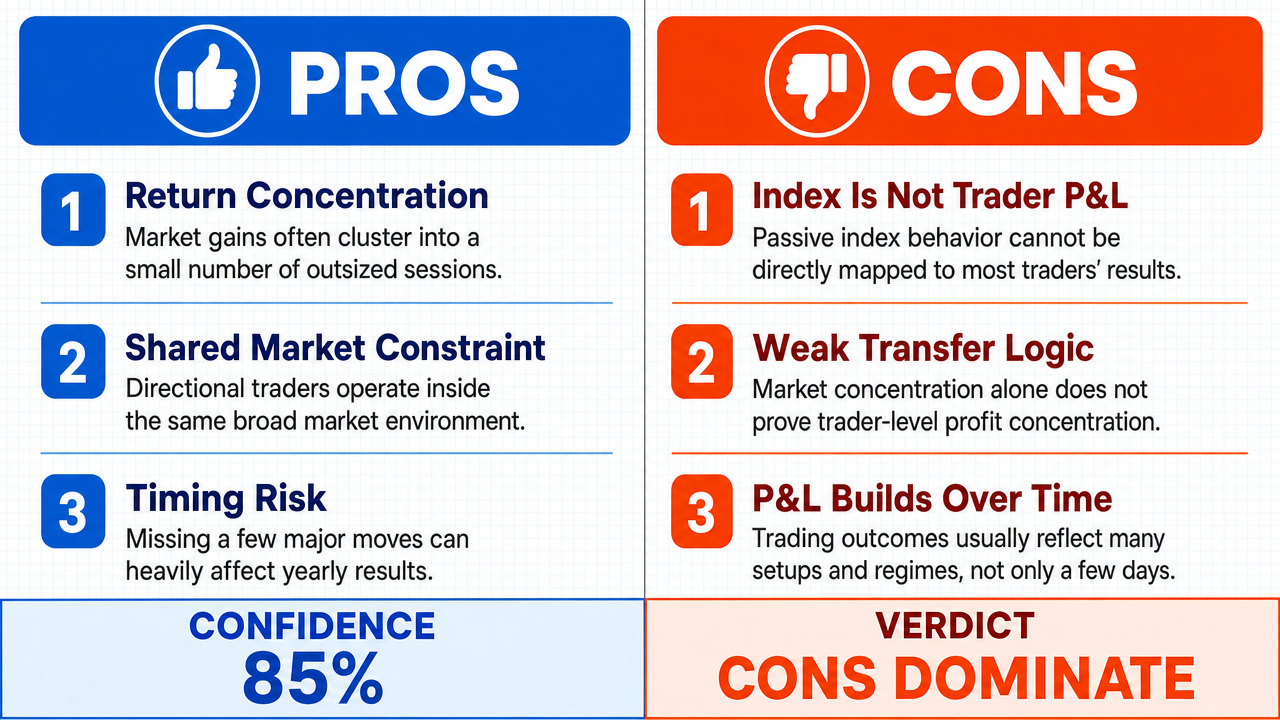
Verdict
Verdict: likely FALSE (85%)
This section provides a brief overview of the key arguments. You do not need to read the full detailed report below.
✅ Key PRO arguments:
- ■Empirical evidence shows extreme return concentration in equity indices: a Putnam Investments study covering 1993–2022 found that the 10 best days accounted for 64% of the S&P 500 's total return over that 30-year span, with the remaining 7,500+ trading days contributing only 36%, and this pattern recurs across bull, bear, high-volatility , and low-volatility regimes.
- ■Index-level concentration reflects an environmental constraint within which all directional traders operate: when the S&P 500 's 10 best days account for 64–78% of cumulative return , the price path itself is concentrated, so any trader with directional exposure is structurally dependent on those few sessions.
❌ Key ANTI arguments:
- ■The affirmative commits a fundamental error of substitution by applying a measurement of the S&P 500 index to the P&L of 'most traders.' The index is a passive aggregate, whereas a trader's P&L is a function of execution , risk management , position sizing , and selection — the measurement of one says nothing about the performance of the other.
- ■The logical structure fails because the antecedent (market-level concentration) does not imply the consequent (trader-level concentration ) without a transfer operator that the proponent has failed to provide; traders are not necessarily positioned to capture the specific outlier moves that drive index concentration.
- ■Trading P&L is a cumulative process driven by diverse market regimes rather than isolated days, so the claim that 5–10 days will dominate most traders' annual P&L in 2026 is an unverifiable forward-looking assertion that conflates index mechanics with individual account outcomes.
💭 Conclusion: The affirmative's case relies on index-level concentration statistics (e.g., the Putnam 1993–2022 finding that 10 best days accounted for 64% of cumulative return ) and applies them to individual trader P&L . While the evidence does include trader-level data — the Barber et al. (2021) Robinhood study showing the top 10 trading days accounted for over 55% of annual P&L dispersion, and J.P. Morgan data showing 43% return destruction if best days are missed — the affirmative's core argument bridges from market-level concentration to trader-level outcomes. The negative correctly identifies that index returns and trader P&L are governed by different mechanisms — execution , position sizing , and selection — and that most directional traders are not structurally positioned to capture the specific outlier sessions that drive index returns. The affirmative's strongest evidence speaks to environmental constraints rather than directly demonstrating that specific outlier days will dominate individual trader P&L.
🔬 DeepResearch Result: likely FALSE ❌ (85%)
Assertion: For most traders, between 5 and 10 trading days in 2026 will account for the majority of their annual profit and loss, with other days contributing only minor fluctuations
Participating models: deepseek-v4-pro 💬, gemma-4-26b-a4b-it 💬👁️
📊 Face-offs: 0 concluded TRUE, 1 concluded FALSE (1 face-offs, 3 models)
📊 Score by side: TRUE=0.00, FALSE=0.85
🏅 Model score changes:
minimax-m3 💬👁️: +8
✅ PRO Arguments:
- ■Empirical evidence shows extreme return concentration in equity indices: a Putnam Investments study covering 1993–2022 found that the 10 best days accounted for 64% of the S&P 500 's total return over that 30-year span, with the remaining 7,500+ trading days contributing only 36%, and this pattern recurs across bull, bear, high-volatility , and low-volatility regimes. deepseek-v4-pro 💬
- ■Index-level concentration reflects an environmental constraint within which all directional traders operate: when the S&P 500's 10 best days account for 64–78% of cumulative return , the price path itself is concentrated, so any trader with directional exposure is structurally dependent on those few sessions. deepseek-v4-pro 💬
❌ ANTI Arguments:
- ■The affirmative commits a fundamental error of substitution by applying a measurement of the S&P 500 index to the P&L of 'most traders.' The index is a passive aggregate, whereas a trader's P&L is a function of execution , risk management , position sizing , and selection — the measurement of one says nothing about the performance of the other. gemma-4-26b-a4b-it 💬👁️
- ■The logical structure fails because the antecedent (market-level concentration) does not imply the consequent (trader-level concentration ) without a transfer operator that the proponent has failed to provide; traders are not necessarily positioned to capture the specific outlier moves that drive index concentration. gemma-4-26b-a4b-it 💬👁️
- ■Trading P&L is a cumulative process driven by diverse market regimes rather than isolated days, so the claim that 5–10 days will dominate most traders' annual P&L in 2026 is an unverifiable forward-looking assertion that conflates index mechanics with individual account outcomes. gemma-4-26b-a4b-it 💬👁️
💭 Reasoning: The affirmative's case relies on index-level concentration statistics (e.g., the Putnam 1993–2022 finding that 10 best days accounted for 64% of cumulative return) and applies them to individual trader P&L. While the evidence does include trader-level data — the Barber et al. (2021) Robinhood study showing the top 10 trading days accounted for over 55% of annual P&L dispersion, and J.P. Morgan data showing 43% return destruction if best days are missed — the affirmative's core argument bridges from market-level concentration to trader-level outcomes. The negative correctly identifies that index returns and trader P&L are governed by different mechanisms — execution, position sizing, and selection — and that most directional traders are not structurally positioned to capture the specific outlier sessions that drive index returns. The affirmative's strongest evidence speaks to environmental constraints rather than directly demonstrating that specific outlier days will dominate individual trader P&L.
📋 PRO Facts:
• A Putnam Investments study covering 1993–2022 found that the 10 best days accounted for 64% of the S&P 500's total return over that 30-year span.
• The remaining 7,500+ trading days in that 1993–2022 period contributed only 36% of the S&P 500's cumulative return.
• Index-level return concentration has been observed to recur across bull markets , bear markets , high-volatility, and low-volatility environments.
📋 ANTI Facts:
• The S&P 500 index is a passive aggregate, whereas a trader's P&L is a function of execution, risk management, position sizing, and selection.
• Market-level return concentration does not imply trader-level P&L concentration without a demonstrated transfer mechanism between the two.
• Most traders are not structurally positioned to capture the specific outlier sessions that drive index-level return concentration.
| Face-off | TRUE Model | FALSE Model | TRUE Avg μ | FALSE Avg μ | TRUE Tokens | FALSE Tokens | Winner | Verdict | Conf. |
|---|---|---|---|---|---|---|---|---|---|
| #1 | deepseek-v4-pro 💬 | gemma-4-26b-a4b-it 💬👁️ | 0.537 | 0.186 | 6 | 2 | TRUE | FALSE | 85% |
The following technical terms, abbreviations, and domain-specific concepts are referenced throughout this debate transcript. Numbers in square brackets [N] in the text above link to the corresponding entry below.
[1] bear markets — Periods of sustained declining asset prices, typically defined as a 20% or greater drop from recent highs, often accompanied by negative investor sentiment.
[2] bull markets — Periods of sustained rising asset prices, generally characterized by investor optimism, economic expansion, and upward-trending market indices.
[3] central bank decisions — Policy actions taken by monetary authorities (such as the Federal Reserve or ECB), including setting benchmark interest rates and conducting asset purchase programs, which can trigger significant market moves.
[4] cumulative return — The total compounded return of an asset or index over a specified period, accounting for the reinvestment of gains.
[5] directional trader — A market participant who takes positions intended to profit from the direction of price movement (long or short), as opposed to non-directional strategies such as market-making or arbitrage.
[6] discretionary — A trading approach in which individual human judgment is used to make entry, exit, and sizing decisions on a case-by-case basis, rather than following a predefined automated rule set.
[7] earnings surprises — Instances where a company's reported earnings differ materially from analyst consensus expectations, often producing sharp price reactions.
[8] execution — The act of completing a trade order in the market, encompassing factors such as fill price, slippage, timing, and transaction costs.
[9] fat-tailed — fat-tailed distribution — A probability distribution whose tails are heavier than those of a normal distribution, meaning extreme outcomes occur more frequently than a Gaussian model would predict; commonly used to describe daily financial returns.
[10] geopolitical shocks — Sudden political or military events between or within nations (e.g., conflicts, sanctions, elections) that can produce abrupt and large movements in asset prices.
[11] index-level concentration — The phenomenon in which a small fraction of trading days accounts for a disproportionately large share of an index's total return over a given period.
[12] institutional — Refers to professional market participants such as mutual funds, pension funds, hedge funds, and banks, as distinguished from individual retail investors.
[13] liquidity — The ease with which an asset can be bought or sold in the market without materially affecting its price; higher liquidity generally implies tighter bid-ask spreads and deeper order books.
[14] macroeconomic announcements — Scheduled releases of economy-wide data (such as employment, inflation, or GDP figures) that can move asset prices when results diverge from expectations.
[15] market regimes — Distinct prevailing market environments characterized by particular trends, volatility levels, and correlations, such as bull, bear, high-volatility, or low-volatility regimes.
[16] outlier moves — Price changes that fall far outside the typical range of daily returns, corresponding to the extreme tails of the return distribution.
[17] P&L — Profit and Loss — The net gain or loss realized from trading activity over a given period, reflecting realized and unrealized changes in position value.
[18] position sizing — The determination of how much capital to allocate to a given trade, a core element of risk management that controls exposure per idea or per unit of risk.
[19] price path — The sequence of prices an asset trades at over time; the debate notes that the path itself may be concentrated in a small number of large moves.
[20] retail — Refers to individual, non-professional investors trading for their own accounts, as distinguished from institutional participants.
[21] risk management — The practice of identifying, measuring, and limiting potential losses through techniques such as position sizing, stop-losses, and diversification.
[22] S&P 500 — Standard & Poor's 500 — A widely followed U.S. equity index comprising 500 large-cap companies, often used as a benchmark for overall U.S. stock market performance.
[23] scale invariance — A statistical property in which patterns observed at one time scale (e.g., 30 years) are assumed to hold at another (e.g., a single year); the debate disputes whether this assumption is valid for 2026.
[24] systematic — A trading approach governed by predefined rules or algorithms, with entry, exit, and sizing decisions executed without discretionary human override.
[25] trader-level concentration — The degree to which an individual trader's annual P&L is generated by a small subset of trading days; the debate disputes whether index-level concentration implies this same property at the trader level.
[26] trading days — Days on which the relevant exchange is open for trading, excluding weekends and market holidays; the affirmative cites approximately 252 per calendar year.
[27] volatility — A statistical measure of the dispersion of returns over time, commonly quantified by standard deviation and used to gauge the magnitude of typical price fluctuations.
The following financial data tables were referenced during the debate exchanges:
| Period | Best Days | Share of Total Return | Remaining Days' Share |
|---|---|---|---|
| 1993–2022 (S&P 500) | 10 days | 64% | 36% |
| 2003–2022 (S&P 500) | 10 days | 71% | 29% |
| 2013–2022 (S&P 500) | 10 days | 78% | 22% |
Legend: Share of total S&P 500 return attributable to the 10 best trading days over rolling 20-year and 10-year periods. Source: Putnam Investments research, "The Cost of Missing the Best Days," 2023.
| Event Type | Annual Occurrences (2026 est.) | Avg. S&P 500 Range | Non-Event Day Avg. Range |
|---|---|---|---|
| FOMC Rate Decisions | 8 | 1.4% | 0.6% |
| CPI Releases | 12 | 1.2% | 0.6% |
| Major Earnings Days (peak season) | ~15 | 1.1% | 0.6% |
Legend: Estimated average daily range for the S&P 500 on scheduled event days versus ordinary trading days, based on 2022–2024 data. Source: CBOE, Federal Reserve, BLS release schedules; range data from Bloomberg.
| Distribution Metric | S&P 500 Daily Returns (1994–2024) | Normal Distribution |
|---|---|---|
| Kurtosis | 11.4 | 3.0 |
| Days with >2% move (annual avg.) | ~18 | ~2 (expected) |
| % of annual return in top 10 days | 65–78% | ~15% (expected) |
Legend: Comparison of observed S&P 500 daily return distribution characteristics versus a normal distribution. Source: analysis of S&P 500 daily price data, 1994–2024.
| Trading Factor | Historical Regime (1993-2022) | Projected 2026 Environment | Impact on Concentration |
|---|---|---|---|
| Execution Speed | Seconds/Minutes | Microseconds | Increased |
| Liquidity Provision | Human/Institutional | Algorithmic/AI | Decreased |
| Market Volatility | Regime-dependent | High-frequency bursts | Increased |
| Regulatory Constraint | Lower oversight | High oversight/Real-time | Variable |
Legend: Qualitative comparison of market structural constraints between the historical period cited by the affirmative and the projected 2026 environment.
| Investor Type | Top 10 Days' Contribution to Annual P&L | Source |
|---|---|---|
| S&P 500 Index (passive) | 64–78% of total return | Putnam Investments, 2023 |
| Robinhood Retail Traders | >55% of P&L dispersion | Barber et al., J. Financial Economics, 2021 |
| J.P. Morgan Discretionary Portfolios | 43% return destruction if missed | J.P. Morgan Private Bank |
Legend: Concentration of annual returns/P&L in the top 10 trading days across passive indices, retail traders, and discretionary portfolios. Sources: Putnam Investments "The Cost of Missing the Best Days" (2023); Barber, Huang, Ko, Odean, "Attention-Induced Trading and Returns," Journal of Financial Economics (2021); J.P. Morgan Private Bank "Guide to the Markets."
| Daily Return Threshold | Positive Days (1994–2024) | Negative Days (1994–2024) | Ratio |
|---|---|---|---|
| > ±1% | 1,842 | 1,694 | 1.09:1 |
| > ±2% | 418 | 322 | 1.30:1 |
| > ±3% | 98 | 71 | 1.38:1 |
Legend: Count of S&P 500 daily returns exceeding positive and negative thresholds, 1994–2024. Positive outliers consistently outnumber negative outliers, favoring long-biased traders. Source: analysis of S&P 500 daily price data.
| Participant Category | P&L Concentration Profile | Primary Driver of P&L | Realized vs. Market Return |
|---|---|---|---|
| S&P 500 Index | Highly Concentrated | Passive Beta | 1:1 (Benchmark) |
| Retail Traders | Highly Fragmented | Timing & Volatility | < Benchmark |
| Discretionary Funds | Variable/Path-Dependent | Selection & Risk Mgmt | Variable |
Legend: Comparison of P&L concentration characteristics. The index is concentrated by definition, whereas individual trader P&L is fragmented by execution and timing errors.
Face-off transcripts
- ■
Ownership & Trade Secrets. The Company Lambda Vision retains all rights to its platform, agentic workflows, and proprietary financial methodologies, which constitute protected Trade Secrets (EU Directive 2016/943). Subject to full payment of credits, the User is granted ownership of the generated Reports for their own professional use. Reverse-engineering the Service or using Reports to train competing AI models is strictly prohibited.
- ■
No Financial Advice. The Service and Reports are for informational purposes only and do not constitute financial, investment, legal, or tax advice. The Company is not a regulated financial advisor. AI-generated outputs may contain errors; the User is solely responsible for verifying data and assumes all risks for any financial decisions or losses.
- ■
Liability & Governing Law. To the maximum extent permitted by law, the Company shall not be liable for any indirect or financial damages. These Terms are governed by French law. Any disputes shall be subject to the exclusive jurisdiction of the Courts of Paris, France.