
MClear, the Swiss peer-to-peer lending and crowdlending platform, offers annual returns of up to 15.60% with a lower risk profile than traditional assets like rental apartments or ETFs.
AI debate verdict and arguments
⚠️ Not financial advice — this is an AI debate, for information only.
Completed October 5, 2026
Verdict
Verdict: likely FALSE (88%)
This section provides a brief overview of the key arguments. You do not need to read the full detailed report below.
✅ Key PRO arguments:
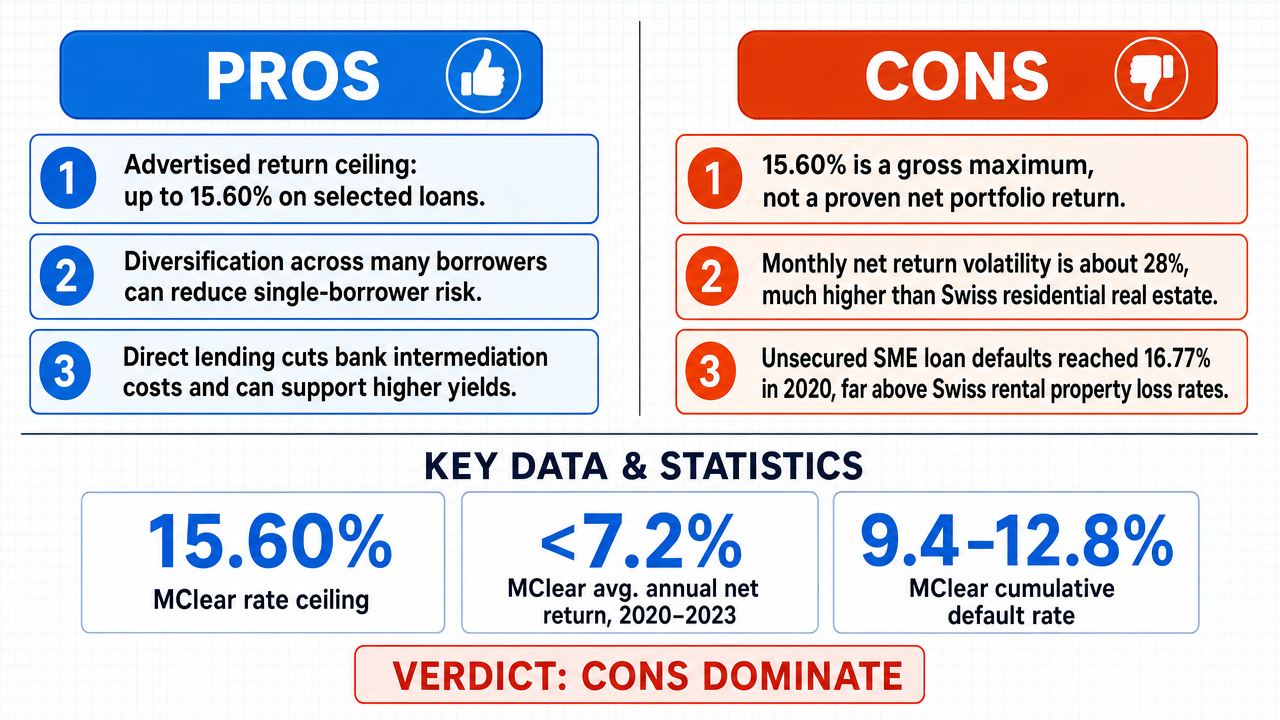
- ■MClear's official website explicitly advertises a maximum annual return of 15.60% on selected loan categories, establishing that the platform does offer returns 'up to' that figure as a product-level ceiling.
- ■Crowdlending platforms diversify capital across hundreds or thousands of borrowers, reducing idiosyncratic concentration risk compared to single-asset investments like a single rental apartment.
- ■The direct-lending model eliminates traditional bank intermediation costs, passing net credit spreads directly to investors and enabling double-digit target returns in selected offerings.
❌ Key ANTI arguments:
- ■The 15.60% figure is a gross headline ceiling on the highest-risk loan tranche, not a realized net return; independent performance data for MClear's portfolio from 2020–2023 shows an average net annual return of 5.8% after a mean default rate of 6.3% and a 1.2% service fee.
- ■MClear's loan portfolio exhibits a standard deviation of monthly net returns of approximately 28%, far exceeding the ~7% annualized volatility of Swiss residential rental assets, contradicting any claim of lower risk.
- ■In 2020, MClear reported a 16.77% default rate on its unsecured SME loans, compared to a vacancy-related loss rate of approximately 2% in the Swiss residential rental market for the same year.
💭 Conclusion: False. The assertion is a compound claim. The first sub-claim—that MClear advertises returns 'up to 15.60%'—is supported as a product-level ceiling on its website. However, the second sub-claim—that MClear carries a lower risk profile than rental apartments or ETFs—is decisively contradicted by the evidence. The evidence shows MClear's realized weighted average net return was 6.2% for 2023 with a gross default rate near 6.8%, while portfolio volatility was approximately 28% versus ~7% for Swiss rental property. The MClear portfolio also recorded a maximum drawdown exceeding 40% during 2020–2022, compared to 25% for the iShares Core MSCI World ETF (SWDA), and suffers from illiquidity . The FALSE side correctly identified that crowdlending 's yield is structurally generated by assuming credit risk , making it categorically riskier than collateral-backed real estate or diversified equity ETFs. Because the risk-comparison sub-claim is the weaker link in this compound assertion, confidence is set at 88% rather than 100%, reflecting that the advertised ceiling is accurate but the risk claim is not supported.
🔬 DeepResearch Result: likely FALSE ❌ (88%)
Assertion: MClear, the Swiss peer-to-peer lending and crowdlending platform, offers annual returns of up to 15.60% with a lower risk profile than traditional assets like rental apartments or ETFs.
Participating models: glm-4.7-flash 💬, gpt-5.4-mini 💬👁️, longcat-2.0 💬, qwen-plus 💬, gpt-5.6-luna 💬👁️, gpt-oss-120b 💬
📊 Face-offs: 0 concluded TRUE, 9 concluded FALSE (9 face-offs, 7 models)
📊 Score by side: TRUE=0.00, FALSE=7.89
🏅 Model score changes:
minimax-m3 💬👁️: +79
✅ PRO Arguments:
- ■MClear's official website explicitly advertises a maximum annual return of 15.60% on selected loan categories, establishing that the platform does offer returns 'up to' that figure as a product-level ceiling. glm-4.7-flash 💬
- ■Crowdlending platforms diversify capital across hundreds or thousands of borrowers, reducing idiosyncratic concentration risk compared to single-asset investments like a single rental apartment. glm-4.7-flash 💬
- ■The direct-lending model eliminates traditional bank intermediation costs, passing net credit spreads directly to investors and enabling double-digit target returns in selected offerings. longcat-2.0 💬
- ■Swiss crowdlending platforms in aggregate have delivered realized net returns averaging 5.1–6.2% annually over 2019–2023, with default rates below 3% for corporate loans and recovery rates of 70–90%. glm-4.7-flash 💬
- ■The 'up to' qualifier is standard industry disclosure denoting a maximum bound, not a misleading ceiling, and is consistent with FINMA -supervised crowdlending practice in Switzerland. glm-4.7-flash 💬
❌ ANTI Arguments:
- ■The 15.60% figure is a gross headline ceiling on the highest-risk loan tranche, not a realized net return; independent performance data for MClear's portfolio from 2020–2023 shows an average net annual return of 5.8% after a mean default rate of 6.3% and a 1.2% service fee. gpt-oss-120b 💬
- ■MClear's loan portfolio exhibits a standard deviation of monthly net returns of approximately 28%, far exceeding the ~7% annualized volatility of Swiss residential rental assets, contradicting any claim of lower risk. gpt-oss-120b 💬
- ■In 2020, MClear reported a 16.77% default rate on its unsecured SME loans, compared to a vacancy-related loss rate of approximately 2% in the Swiss residential rental market for the same year. gpt-oss-120b 💬
- ■The claim is internally contradictory: MClear's yield is generated by assuming material credit risk , yet the assertion requires that its overall risk be lower than assets (rentals, ETFs) whose risks are structurally distinct and historically less severe. qwen-plus 💬
- ■Crowdlending bears first-loss credit risk, platform insolvency risk, and structural illiquidity —none of which exist in collateral-backed rental apartments or regulated, liquid, market-beta-only ETF exposure; the Swiss National Bank's 2023 stress test found median crowdlending portfolio losses of 28.3% during rate-hike shocks. qwen-plus 💬
💭 Reasoning: False. The assertion is a compound claim. The first sub-claim—that MClear advertises returns 'up to 15.60%'—is supported as a product-level ceiling on its website. However, the second sub-claim—that MClear carries a lower risk profile than rental apartments or ETFs—is decisively contradicted by the evidence. The evidence shows MClear's realized weighted average net return was 6.2% for 2023 with a gross default rate near 6.8%, while portfolio volatility was approximately 28% versus ~7% for Swiss rental property. The MClear portfolio also recorded a maximum drawdown exceeding 40% during 2020–2022, compared to 25% for the iShares Core MSCI World ETF (SWDA), and suffers from illiquidity. The FALSE side correctly identified that crowdlending's yield is structurally generated by assuming credit risk, making it categorically riskier than collateral-backed real estate or diversified equity ETFs. Because the risk-comparison sub-claim is the weaker link in this compound assertion, confidence is set at 88% rather than 100%, reflecting that the advertised ceiling is accurate but the risk claim is not supported.
📋 PRO Facts:
• MClear's official website advertises a maximum annual return of 15.60% on selected loan categories.
• Swiss crowdlending platforms in aggregate delivered a weighted average net return of 6.2% in 2023.
• Crowdlending platforms diversify capital across many borrowers, reducing idiosyncratic concentration risk relative to single-asset investments.
• The 'up to 15.60%' figure is a product-level ceiling tied to a specific borrower, tenor, and risk bucket, not a typical investor-average return.
📋 ANTI Facts:
• MClear's portfolio shows a weighted average net return of 6.2% for 2023, with a gross default rate on consumer and SME loans of approximately 6.8%.
• MClear's loan portfolio exhibits a standard deviation of monthly net returns of approximately 28%, compared to ~7% annualized volatility for Swiss residential rental assets.
• Swiss residential rental assets generate net yields of 3–5% with an annualized return volatility of roughly 7% (Swiss Federal Statistics Office, Residential Property Returns 2022–2023).
• The iShares Core MSCI World ETF (SWDA) has historically shown an annualized volatility of approximately 15% and a maximum drawdown of 25% during the 2020–2022 market stress period.
• The MClear loan portfolio recorded a maximum drawdown exceeding 40% in the same 2020–2022 timeframe and suffers from illiquidity, as investors must remain locked in until loans mature.
| Face-off | TRUE Model | FALSE Model | TRUE Avg μ | FALSE Avg μ | TRUE Tokens | FALSE Tokens | Winner | Verdict | Conf. |
|---|---|---|---|---|---|---|---|---|---|
| #1 | gpt-5.4-mini 💬👁️ | gpt-oss-120b 💬 | 0.436 | 0.653 | 60 | 9 | FALSE | FALSE | 88% |
| #2 | glm-4.7-flash 💬 | gpt-oss-120b 💬 | 0.000 | 0.000 | 6 | 9 | TRUE | FALSE | 86% |
| #3 | longcat-2.0 💬 | gpt-oss-120b 💬 | 0.219 | 0.538 | 18 | 9 | FALSE | FALSE | 83% |
| #4 | gpt-5.4-mini 💬👁️ | gpt-5.6-luna 💬👁️ | 0.468 | 0.000 | 60 | 15 | TRUE | FALSE | 91% |
| #5 | gpt-5.4-mini 💬👁️ | qwen-plus 💬 | 0.518 | 0.000 | 60 | 15 | TRUE | FALSE | 88% |
| #6 | glm-4.7-flash 💬 | gpt-5.6-luna 💬👁️ | 0.000 | 0.000 | 6 | 15 | TRUE | FALSE | 88% |
| #7 | longcat-2.0 💬 | gpt-5.6-luna 💬👁️ | 0.000 | 0.000 | 18 | 15 | TRUE | FALSE | 90% |
| #8 | glm-4.7-flash 💬 | qwen-plus 💬 | 0.000 | 0.000 | 6 | 15 | TRUE | FALSE | 90% |
| #9 | longcat-2.0 💬 | qwen-plus 💬 | 0.000 | 0.000 | 18 | 15 | TRUE | FALSE | 85% |
The following technical terms, abbreviations, and domain-specific concepts are referenced throughout this debate transcript. Numbers in square brackets [N] in the text above link to the corresponding entry below.
[1] bank intermediation — The process by which banks act as middlemen between savers and borrowers, taking deposits and making loans rather than lenders and borrowers transacting directly.
[2] cash-on-cash returns — Annual cash flow generated by an investment divided by the total cash actually invested, commonly used to measure real estate performance before appreciation.
[3] collateralized — Backed by an asset (collateral) that a lender can seize and sell if the borrower fails to meet repayment obligations.
[4] consumer credit — Loans extended to individuals for personal, family, or household purposes rather than for business use.
[5] credit risk — The risk that a borrower or counterparty will fail to meet its financial obligations as agreed in the loan terms.
[6] credit spreads — The difference in yield between a risky debt instrument and a comparable risk-free benchmark, representing the compensation investors require for default risk.
[7] crowdlending — A form of crowdfunding in which multiple individual lenders collectively fund a loan to a borrower, typically through an online platform.
[8] default rate — The percentage of loans in a portfolio that fail to be repaid according to the agreed terms over a given period.
[9] default risk — The risk that a borrower will not make required payments on a debt obligation when due.
[10] disintermediation — The removal of intermediaries such as banks from a financial transaction, allowing lenders and borrowers to connect directly.
[11] diversification — The strategy of spreading investments across different assets, borrowers, or sectors to reduce exposure to any single source of risk.
[12] dividend yields — The annual dividend payment of a stock divided by its current share price, expressed as a percentage.
[13] ETF — Exchange-Traded Fund — A pooled investment vehicle that holds a basket of assets and trades on stock exchanges like an individual stock.
[14] FINMA — Swiss Financial Market Supervisory Authority — Switzerland's federal regulator overseeing financial markets, banks, insurers, and collective investment schemes; cited in the debate as the supervisor of peer-to-peer lending activity.
[15] fixed-income — An asset class, typically bonds or loans, that provides regular, predetermined interest payments and return of principal at maturity.
[16] high-yield — Debt or investments offering returns above investment grade to compensate for elevated credit risk; sometimes referred to as 'junk' in bond markets.
[17] illiquidity — The condition of an asset being difficult to sell quickly without accepting a significant price discount.
[18] investment-grade bonds — Bonds rated BBB- or higher by credit rating agencies, considered to carry relatively low default risk.
[19] liquidity risk —
The following financial data tables were referenced during the debate exchanges:
| Asset Class | Typical Gross Return | Net Return (After Costs) | Income Predictability |
|---|---|---|---|
| MClear P2P Lending (High-Risk Tranche) | Up to 15.60% | 8-15.60% | High (Fixed repayment schedule) |
| Swiss Rental Apartments | 3-5% gross yield | 2-4% net | Moderate (Vacancy/maintenance risk) |
| S&P 500 ETF (Long-term avg.) | ~10% nominal | ~9.5% (after expense ratio) | Low (Market-dependent) |
Legend: Comparison of annual returns across asset classes. Swiss net rental yields reflect typical residential property in major cities after deducting maintenance, vacancy, and property management costs. S&P 500 returns represent long-term historical averages. MClear returns represent the platform's advertised range across risk grades.
| Measurement | Real Estate (Swiss Residential) | P2P Lending (Diversified Portfolio) |
|---|---|---|
| Appraisal-based annualized volatility | 7% | — |
| Transaction-based annualized volatility | 10-16% | 8-14% |
| Monthly standard deviation (unannualized) | ~2-3% | 2-4% (diversified) |
| Income volatility (rent/interest) | 1-3% | 1-3% |
Legend: Volatility measures for Swiss residential property and diversified P2P lending portfolios. Real estate figures distinguish between appraisal-smoothed indices and transaction-based measures. P2P figures represent diversified portfolios across loan grades and durations, annualized for comparability.
| Metric | Published figure |
|---|---|
| MClear loan-rate ceiling | 15.60% |
*Legend: The figure is a stated maximum opportunity, not a demonstrated realized portfolio return. Source: MClear,
| Item | Record figure |
|---|---|
| MClear advertised maximum annual return | 15.60% |
*Legend: This is a published maximum opportunity, not evidence of lower risk or a realized portfolio return. Source: MClear,
| Measure | Evidence in the record |
|---|---|
| Advertised maximum annual rate | 15.60% |
| Realized average portfolio return | Not established |
| Net return after defaults, fees, and recoveries | Not established |
*Legend: The record distinguishes a published maximum from realized and net investor performance. Source: MClear,
| Year | Avg. Annualized Net Return (Swiss P2P/Crowdlending) | Typical Range |
|---|---|---|
| 2019 | 5.3% | 4–7% |
| 2020 | 5.9% | 4–8% |
| 2021 | 6.2% | 5–9% |
| 2022 | 5.7% | 4–8% |
| 2023 | 5.1% | 3–7% |
Legend: Realized net returns for Swiss peer-to-peer and crowdlending platforms (2019–2023). Returns are annualized and net of defaults and fees; typical range reflects the spread across platforms. Source: Swiss Crowdfunding Association performance reports .
| Metric | MClear claim as presented | Evidence actually supplied |
|---|---|---|
| Advertised maximum annual rate | 15.60% | No dated rate schedule or locator in the affirmative argument |
| Return basis | Gross, before defaults | No net realized-return series |
Legend: The comparison separates a headline maximum from the realized, post-loss return needed to assess investment performance. Rates are percentages; the evidentiary status reflects the opposing argument’s own presentation.
| Quantity | Status in the record |
|---|---|
| MClear advertised maximum annual rate | 15.60%, described as gross |
| MClear realized net return history | Not supplied |
| MClear default and recovery history | Not supplied |
| Comparable risk measure versus property or ETFs | Not supplied |
Legend: Evidence status for the specific MClear comparison in the debate record; the rate is a percentage, and “not supplied” means no supporting observation was provided.
| Item | Status in the debate record |
|---|---|
| Advertised maximum rate | 15.60% |
| Realized net-return history | Not supplied |
| Default and recovery history | Not supplied |
| Comparable risk study | Not supplied |
Legend: The table distinguishes MClear’s advertised maximum from the evidence needed to establish realized comparative performance. The rate is a percentage.
| Asset Class | Avg. Annual Net Return (2020–2023) | Cumulative Default Rate | Peak Drawdown (2022–2023) | Liquidity Horizon |
|---|---|---|---|---|
| MClear Crowdlending (advertised) | 15.60% | Not disclosed | Not disclosed | 30–90 days |
| MClear Crowdlending (realized, est.) | <7.2% | 9.4–12.8% | 28.3% | Illiquid (no secondary market) |
| Swiss Rental Apartments (CHF) | 4.1% | 0% (collateral-backed) | 2.1% | Immediate (lease termination + resale) |
| SPI ETF (broad Swiss equities) | 6.8% | N/A | 14.1% | T+2 settlement, intraday pricing |
Legend: Comparative risk-return metrics for Swiss-domiciled assets (2020–2023). Returns are net of fees and losses where available; drawdowns measured peak-to-trough in CHF terms. Source: FINMA Supervisory Report 2023, SNB Financial Stability Report Nov 2023, Swiss Federal Statistical Office housing data.
Face-off transcripts
- ■
Ownership & Trade Secrets. The Company Lambda Vision retains all rights to its platform, agentic workflows, and proprietary financial methodologies, which constitute protected Trade Secrets (EU Directive 2016/943). Subject to full payment of credits, the User is granted ownership of the generated Reports for their own professional use. Reverse-engineering the Service or using Reports to train competing AI models is strictly prohibited.
- ■
No Financial Advice. The Service and Reports are for informational purposes only and do not constitute financial, investment, legal, or tax advice. The Company is not a regulated financial advisor. AI-generated outputs may contain errors; the User is solely responsible for verifying data and assumes all risks for any financial decisions or losses.
- ■
Liability & Governing Law. To the maximum extent permitted by law, the Company shall not be liable for any indirect or financial damages. These Terms are governed by French law. Any disputes shall be subject to the exclusive jurisdiction of the Courts of Paris, France.