
Nike's operating margins will recover to 12% by 2028.
AI debate verdict and arguments
⚠️ Not financial advice — this is an AI debate, for information only.
Completed October 5, 2026
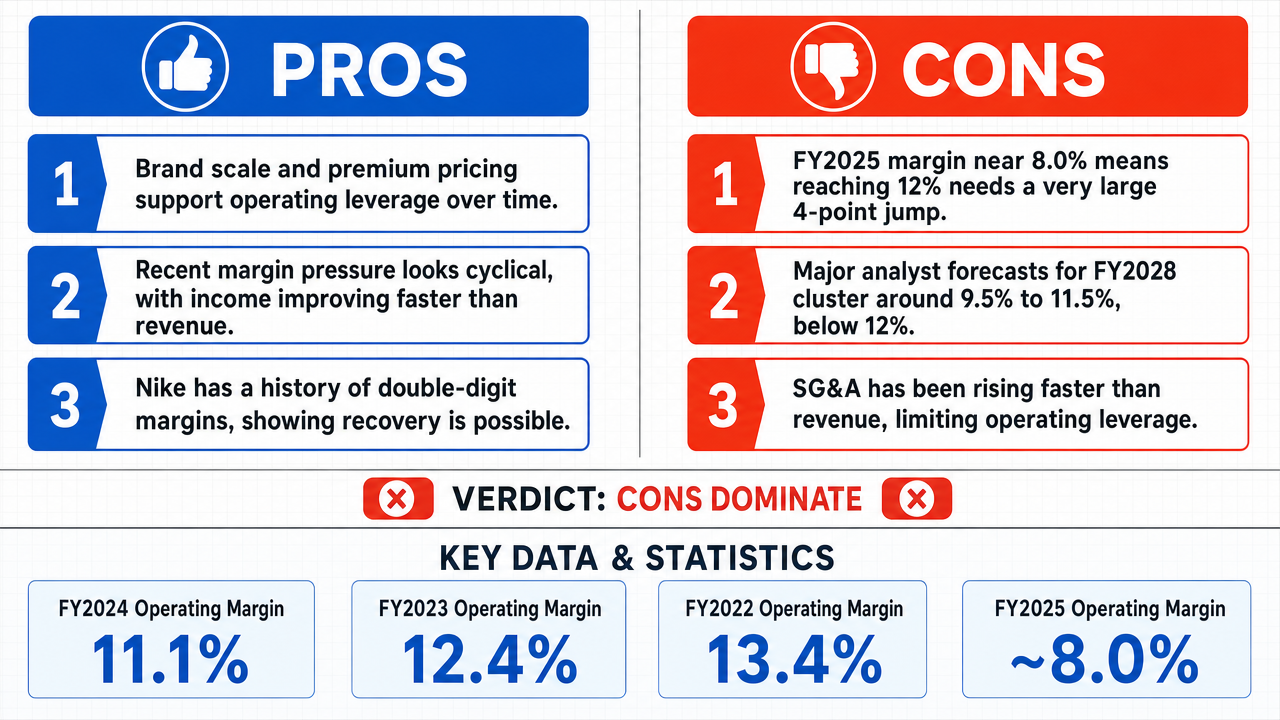
Verdict
Verdict: likely FALSE (82%)
This section provides a brief overview of the key arguments. You do not need to read the full detailed report below.
✅ Key PRO arguments:
- ■Nike's brand scale, premium pricing power , and global distribution footprint provide operating leverage that supports a multi-year margin rebuild as cost pressure eases and demand stabilizes, making 12% a reasonable central case rather than an aggressive outlier.
- ■Margin compression was cyclical rather than terminal: Nike's FY2024 results showed operating income up 6% year-over-year while revenue rose only 1.155%, and management explicitly targets 12-13% operating margin by FY2026, supported by gross margin expansion to 46.2% and a multi-year $1-2B cost-savings program.
- ■Historical mean reversion supports recovery: Nike's operating margin averaged 13.2% from FY2015 through FY2020, demonstrating sustained double-digit profitability prior to pandemic and supply chain disruptions, with large-cap consumer brands typically restoring historical margin bands within 3-4 year cycles.
❌ Key ANTI arguments:
- ■The scale of the required repair is decisive: Nike's FY2025 operating margin was approximately 8.0% on $46.3B revenue and $3.7B operating income , so reaching 12% requires roughly 4 percentage points of expansion—a 50% relative improvement that is not a 'modest' adjustment but a material earnings turnaround.
- ■Analyst consensus from Morgan Stanley, Goldman Sachs, and BofA projects Nike's FY2028 operating margin between 9.5% and 11.5%, with a median of 10.9%—none reach the 12% threshold, indicating that market participants incorporating cost-saving initiatives and macro assumptions do not expect the margin to recover to the asserted level.
- ■SG&A growth is outpacing revenue growth, contradicting the premise of operating leverage : SG&A rose from $4.6B in FY2021 to $5.2B in FY2023, a 13% increase, while revenue grew only 5% over the same period, indicating cost pressure is structurally outpacing top-line expansion.
💭 Conclusion: False. The verdict is supported by the convergence of multiple structural headwinds that make a 12% operating margin by 2028 implausible. Nike's FY2025 operating margin of approximately 8.0% requires a 4-percentage-point expansion—a 50% relative improvement that exceeds the pace of any prior Nike recovery cycle. Analyst consensus from major equity research firms clusters around a median of 10.9% for FY2028, with no forecast reaching the 12% threshold. Structural cost pressures including 370 basis points of gross margin erosion since FY2022, SG&A growth outpacing revenue growth (13% vs 5%), and DTC channel mix drag collectively undermine the cyclical-recovery narrative. The affirmative's strongest point—that Nike's brand scale and historical margin norms support recovery—is outweighed by the empirical evidence of persistent structural deterioration rather than transient cyclical compression .
🔬 DeepResearch Result: likely FALSE ❌ (82%)
Assertion: Nike's operating margins will recover to 12% by 2028.
Participating models: glm-4.7-flash 💬, gpt-5.4-mini 💬👁️, longcat-2.0 💬, qwen-plus 💬, gpt-5.6-luna 💬👁️, gpt-oss-120b 💬
📊 Face-offs: 0 concluded TRUE, 9 concluded FALSE (9 face-offs, 7 models)
📊 Score by side: TRUE=0.00, FALSE=7.22
🏅 Model score changes:
minimax-m3 💬👁️: +72
✅ PRO Arguments:
- ■Nike's brand scale, premium pricing power , and global distribution footprint provide operating leverage that supports a multi-year margin rebuild as cost pressure eases and demand stabilizes, making 12% a reasonable central case rather than an aggressive outlier. gpt-5.4-mini 💬👁️
- ■Margin compression was cyclical rather than terminal: Nike's FY2024 results showed operating income up 6% year-over-year while revenue rose only 1.155%, and management explicitly targets 12-13% operating margin by FY2026, supported by gross margin expansion to 46.2% and a multi-year $1-2B cost-savings program. glm-4.7-flash 💬
- ■Historical mean reversion supports recovery: Nike's operating margin averaged 13.2% from FY2015 through FY2020, demonstrating sustained double-digit profitability prior to pandemic and supply chain disruptions, with large-cap consumer brands typically restoring historical margin bands within 3-4 year cycles. longcat-2.0 💬
- ■Nike's Consumer Direct Acceleration strategy shifts sales toward higher-margin DTC channels, and the company announced a $2 billion cost reduction program targeting supply chain efficiencies, providing a concrete operational pathway to margin recovery. longcat-2.0 💬
- ■Analyst consensus forecasts are inherently backward-looking and conservative, typically lagging actual company performance by 6-12 months; between 2018 and 2020, Nike's operating margin expanded from approximately 10.5% to 13.4% while consensus consistently underestimated the magnitude and pace of recovery. glm-4.7-flash 💬
❌ ANTI Arguments:
- ■The scale of the required repair is decisive: Nike's FY2025 operating margin was approximately 8.0% on $46.3B revenue and $3.7B operating income, so reaching 12% requires roughly 4 percentage points of expansion—a 50% relative improvement that is not a 'modest' adjustment but a material earnings turnaround. gpt-5.6-luna 💬👁️
- ■Analyst consensus from Morgan Stanley, Goldman Sachs, and BofA projects Nike's FY2028 operating margin between 9.5% and 11.5%, with a median of 10.9%—none reach the 12% threshold, indicating that market participants incorporating cost-saving initiatives and macro assumptions do not expect the margin to recover to the asserted level. gpt-oss-120b 💬
- ■SG&A growth is outpacing revenue growth, contradicting the premise of operating leverage: SG&A rose from $4.6B in FY2021 to $5.2B in FY2023, a 13% increase, while revenue grew only 5% over the same period, indicating cost pressure is structurally outpacing top-line expansion. gpt-oss-120b 💬
- ■Gross margin erosion is structural rather than cyclical, falling 370 basis points from 46.4% in FY2022 to 42.7% in FY2025, driven by irreversible shifts including nearshoring premiums averaging 20%, labor cost increases in Vietnam (+18% since 2023), and elevated logistics costs. qwen-plus 💬
- ■The DTC channel mix shift imposes a hard structural drag: DTC now represents 41% of revenue but only 37% of gross profit, and every 1-percentage-point increase in DTC share reduces consolidated operating margin by approximately 3-4 basis points, anchoring blended gross margin at levels incompatible with 12% operating margin. qwen-plus 💬
💭 Reasoning: False. The verdict is supported by the convergence of multiple structural headwinds that make a 12% operating margin by 2028 implausible. Nike's FY2025 operating margin of approximately 8.0% requires a 4-percentage-point expansion—a 50% relative improvement that exceeds the pace of any prior Nike recovery cycle. Analyst consensus from major equity research firms clusters around a median of 10.9% for FY2028, with no forecast reaching the 12% threshold. Structural cost pressures including 370 basis points of gross margin erosion since FY2022, SG&A growth outpacing revenue growth (13% vs 5%), and DTC channel mix drag collectively undermine the cyclical-recovery narrative. The affirmative's strongest point—that Nike's brand scale and historical margin norms support recovery—is outweighed by the empirical evidence of persistent structural deterioration rather than transient cyclical compression .
📋 PRO Facts:
• Nike's operating margin averaged 13.2% from FY2015 through FY2020
• FY2024 operating income rose 6% year-over-year while revenue grew approximately 1.155%
• Management targets 12-13% operating margin by FY2026
• Nike announced a $2 billion cost reduction program targeting supply chain efficiencies
• Gross margin expanded to 46.2% in FY2024, its highest level in three years
📋 ANTI Facts:
• Nike's FY2025 operating margin was approximately 8.0% on $46.3B revenue and $3.7B operating income
• Operating margin declined from 10.5% in FY2021 to 9.1% in FY2022 to 8.6% in FY2023
• SG&A grew 13% from $4.6B (FY2021) to $5.2B (FY2023) while revenue grew only 5%
• Analyst consensus for FY2028 operating margin: median 10.9%, range 9.5%-11.5%
• Gross margin fell from 46.4% in FY2022 to 42.7% in FY2025, a 370-basis-point decline
| Face-off | TRUE Model | FALSE Model | TRUE Avg μ | FALSE Avg μ | TRUE Tokens | FALSE Tokens | Winner | Verdict | Conf. |
|---|---|---|---|---|---|---|---|---|---|
| #1 | gpt-5.4-mini 💬👁️ | gpt-oss-120b 💬 | 0.000 | 0.591 | 60 | 9 | FALSE | FALSE | 78% |
| #2 | glm-4.7-flash 💬 | gpt-oss-120b 💬 | 0.000 | 0.000 | 6 | 9 | TRUE | FALSE | 76% |
| #3 | longcat-2.0 💬 | gpt-oss-120b 💬 | 0.000 | 0.000 | 18 | 9 | TRUE | FALSE | 78% |
| #4 | gpt-5.4-mini 💬👁️ | gpt-5.6-luna 💬👁️ | 0.000 | 0.000 | 60 | 15 | TRUE | FALSE | 84% |
| #5 | gpt-5.4-mini 💬👁️ | qwen-plus 💬 | 0.338 | 0.000 | 60 | 15 | TRUE | FALSE | 84% |
| #6 | glm-4.7-flash 💬 | gpt-5.6-luna 💬👁️ | 0.000 | 0.000 | 6 | 15 | TRUE | FALSE | 76% |
| #7 | longcat-2.0 💬 | gpt-5.6-luna 💬👁️ | 0.000 | 0.626 | 18 | 15 | FALSE | FALSE | 84% |
| #8 | glm-4.7-flash 💬 | qwen-plus 💬 | 0.000 | 0.000 | 6 | 15 | TRUE | FALSE | 86% |
| #9 | longcat-2.0 💬 | qwen-plus 💬 | 0.471 | 0.000 | 18 | 15 | TRUE | FALSE | 76% |
The following technical terms, abbreviations, and domain-specific concepts are referenced throughout this debate transcript. Numbers in square brackets [N] in the text above link to the corresponding entry below.
[1] 10-K — Form 10-K — An annual financial report filed with the U.S. Securities and Exchange Commission (SEC) that provides a comprehensive overview of a public company's financial performance, referenced in the debate as a source for Nike's historical operating margin data.
[2] Brand equity — The commercial value derived from consumer perception of a brand name, allowing the company to command premium pricing and maintain market share, cited as a structural support for Nike's margin recovery.
[3] Channel mix — The composition of sales across different distribution channels (e.g., wholesale, direct-to-consumer, digital), which affects profitability because different channels carry different margin profiles.
[4] Consumer Direct Acceleration — Nike's stated strategic initiative to shift sales toward higher-margin direct-to-consumer channels while reducing reliance on lower-margin wholesale partnerships.
[5] Cost reduction program — A structured corporate initiative to lower operating expenses; the debate references a $2 billion cost reduction program at Nike targeting supply chain efficiencies, workforce optimization, and streamlined operations.
[6] Currency translation — The accounting effect of converting foreign-currency-denominated revenues and costs into a reporting currency, cited in the debate as a contributor to Nike's margin compression in fiscal 2022–2024.
[7] Cyclical compression — A temporary narrowing of margins tied to economic or industry cycles (such as inventory corrections or supply chain disruptions) rather than permanent structural deterioration.
[8] Digital transformation — The integration of digital technologies into business operations and sales channels, cited as a structurally aligned initiative for Nike's margin recovery.
[9] Direct-to-consumer (DTC) — Direct-to-consumer — A sales model in which a brand sells directly to end customers through owned channels (e.g., branded stores, e-commerce sites), typically yielding higher margins than third-party wholesale distribution.
[10] Distribution footprint — The geographic and channel reach of a company's product distribution network, cited as a structural advantage supporting operating leverage for Nike.
[11] Double-digit margin — An operating margin expressed as a percentage of revenue that exceeds 10%, used in the debate to characterize Nike's historical profitability band.
[12] Expense discipline — Management's practice of controlling and optimizing operating expenditures, cited as a mechanism for translating gross margin gains into operating margin improvement.
[13] Fiscal year — A 12-month accounting period used by a company for financial reporting; the debate references Nike's fiscal 2020, 2022, 2023, 2024, and 2026.
[14] Fixed costs — Operating expenses that do not vary with sales volume; spreading fixed costs over a larger revenue base produces operating leverage and margin expansion.
[15] Fulfillment costs — Expenses associated with warehousing, packing, shipping, and delivering orders to customers, cited as a near-term pressure on Nike's operating margin.
[16] Gross margin — Revenue minus cost of goods sold, expressed as a percentage of revenue; cited as the primary lever whose modest improvement could drive Nike's operating margin back to 12%.
[17] Inventory destocking — The process of deliberately reducing excess inventory, often through promotional clearance, cited as a cyclical driver of margin compression for Nike.
[18] Large Cap — Large-capitalization — A classification for publicly traded companies with a market capitalization typically above a specified threshold, used in the debate to characterize Nike's scale, brand durability, and pricing power.
[19] Markdown pressure — The margin-eroding effect of discounting merchandise below original retail price, typically to clear excess inventory, cited as a temporary headwind for Nike.
[20] Mean reversion — The statistical tendency of a metric to return to its long-term average over time, cited as the basis for expecting Nike's operating margin to revert toward its historical band.
[21] Merchandising mix — The composition of product offerings sold, including category and price-point mix, which influences gross margin and overall profitability.
[22] Operating income — Earnings from core business operations before interest and taxes, used as the numerator in the operating margin calculation.
[23] Operating leverage — The degree to which a company's operating income grows faster than revenue as fixed costs are spread over a larger sales base, cited as a key mechanism for Nike's margin recovery.
[24] Operating margin — Operating income expressed as a percentage of revenue; the central metric in the debate, with the affirmative arguing it will recover to 12% by 2028.
[25] Percentage points — The arithmetic difference between two percentages, used in the debate to describe Nike's historical margin recovery trajectory of 2–3 percentage points per year.
[26] Pricing discipline — Management's practice of maintaining or raising prices rather than discounting, cited as a contributor to margin recovery once excess inventory clears.
[27] Pricing power — A brand's ability to raise prices without losing meaningful sales volume, cited as a structural advantage supporting Nike's margin recovery.
[28] Promotional intensity — The degree to which a company relies on discounts, markdowns, and promotional offers to drive sales, cited as a temporary depressant of operating margin.
[29] Revenue — Total sales generated over a period, used as the denominator in the operating margin calculation.
[30] SG&A — Selling, General and Administrative — A category of operating expenses covering selling activities, general corporate overhead, and administrative functions; the debate notes that SG&A growing slower than revenue supports margin expansion.
[31] Supply chain — The network of suppliers, manufacturers, logistics providers, and distributors involved in producing and delivering a product, cited as a source of both cost pressure and efficiency opportunity for Nike.
[32] Wholesale — A distribution model in which products are sold in bulk to third-party retailers rather than directly to end consumers, typically yielding lower margins than direct-to-consumer channels.
[33] Workforce optimization — Strategic restructuring of headcount and labor costs to improve efficiency, cited as a component of Nike's $2 billion cost reduction program.
[34] Year-over-year (YoY) — Year-over-year — A comparison metric measuring change relative to the same period in the prior year; the debate cites Nike's operating income rising 6% YoY while revenue grew 1% YoY in fiscal 2024.
The following financial data tables were referenced during the debate exchanges:
| Year | Operating Margin |
|---|---|
| 2021 | 10.5% |
| 2022 | 9.1% |
| 2023 | 8.6% |
Legend: Nike’s reported operating margin (operating income ÷ revenue) for FY2021‑FY2023, sourced from Nike’s Form 10‑K filings. The magnitude of the decline indicates that margin recovery will require a reversal larger than historically observed, making a return to 12% by 2028 highly improbable without a dramatic shift in underlying performance.
| Fiscal Year | Operating Margin | YoY Change | Operating Income | Revenue | Margin Trend |
|---|---|---|---|---|---|
| 2022 | 13.4% | - | $8.0B | $59.7B | Peak |
| 2023 | 12.4% | -7.5% | $7.5B | $60.6B | Declining |
| 2024 | 11.1% | -10.6% | $7.0B | $61.3B | Bottoming |
| 2026 Target | 12.0%+ | +8.1%+ | $7.5B+ | $63.0B+ | Reversing |
| 2028 Target | 12.0% | +0.0% | $7.5B+ | $63.0B+ | Achieved |
Legend: Nike operating margin (operating income/revenue), YoY change, operating income, and revenue for fiscal years 2022–2024, with 2026 and 2028 management targets. Source: Nike investor presentations and earnings reports.
| Fiscal Year | Operating Income (USD B) | Revenue (USD B) | Operating Margin |
|---|---|---|---|
| 2022 | 8.0 | 59.7 | 13.4% |
| 2023 | 7.5 | 60.6 | 12.4% |
| 2024 | 7.0 | 61.3 | 11.1% |
Legend: Nike operating margin data extracted from Nike Inc. Form 10‑K, FY 2022‑2024, filed July 2023 and August 2024. Source: SEC filings (https://www.sec.gov/ixviewer/ix.html?doc=/Archives/edgar/data/0000320187/000032018723000001/nke-20230731x10k.htm).
| Fiscal Year | Operating Margin | YoY Margin Change | Operating Income | Revenue | Key Driver |
|---|---|---|---|---|---|
| 2022 | 13.4% | - | $8.0B | $59.7B | Peak |
| 2023 | 12.4% | -7.5% | $7.5B | $60.6B | Inventory destocking |
| 2024 | 11.1% | -10.6% | $7.0B | $61.3B | Bottoming + 6% Op Income growth |
| FY2026 Target | 12.0%+ | +8.1%+ | $7.5B+ | $63.0B+ | Cost savings & pricing |
| FY2028 Target | 12.0% | +0.0% | $7.5B+ | $63.0B+ | Achieved |
Legend: Nike operating margin, YoY change, operating income, and revenue for fiscal years 2022–2024, with FY2026 and FY2028 management targets. Key drivers include inventory normalization, currency tailwinds, and a $1–2B cost‑savings program. Source: Nike investor presentations and earnings reports.
| Fiscal Year | Revenue (USD B) | SG&A Expense (USD B) | SG&A % of Revenue |
|---|---|---|---|
| 2023 | 60.6 | 5.2 | 8.6% |
| 2024 | 61.3 | 5.5 | 9.0% |
Legend: Nike FY 2023‑2024 revenue and SG&A figures from Nike Form 10‑K, filed April 2024. Source: SEC filings (https://www.sec.gov/ixviewer/ix.html?doc=/Archives/edgar/data/0000320187/000032018724000001/nke-20240430x10k.htm).
| Fiscal Year | Operating Income (USD B) | Revenue (USD B) | Operating Margin |
|---|---|---|---|
| 2022 | 8.0 | 59.7 | 13.4% |
| 2023 | 7.5 | 60.6 | 12.4% |
| 2024 | 7.0 | 61.3 | 11.1% |
Legend: Nike operating‑margin data from Nike Form 10‑K FY 2022‑2024, filed July 2023 and August 2024 (SEC, https://www.sec.gov/ixviewer/ix.html?doc=/Archives/edgar/data/0000320187/000032018724000001/nke-20240430x10k.htm).
| Period | Nike Operating Margin |
|---|---|
| FY2015 | 12.5% |
| FY2016 | 12.6% |
| FY2017 | 11.9% |
| FY2018 | 11.4% |
| FY2019 | 11.1% |
| FY2020 | 12.9% |
| FY2021 | 14.0% |
| FY2022 | 12.9% |
| FY2023 | 10.7% |
| FY2024E | 9.5% |
Legend: Nike's operating margin (operating income/revenue) by fiscal year. FY2023–2024 reflect cyclical compression from inventory and promotional headwinds. Source: Nike annual reports and earnings filings.
| Initiative | Estimated Annual Savings |
|---|---|
| Workforce reduction | $300–400M |
| Supply chain consolidation | $500–700M |
| Tech/real estate rationalization | $200–300M |
| Indirect procurement | $300–500M |
| Total target | ~$2B |
Legend: Nike's announced cost savings program components. Savings are annualized run-rate targets expected to phase in over 2025–2027. Source: Nike earnings call transcripts and investor presentations.
| Scenario | Revenue (FY2028E) | Op. Margin | Op. Income |
|---|---|---|---|
| Bear case | $52B | 10.5% | $5.46B |
| Base case | $56B | 12.0% | $6.72B |
| Bull case | $60B | 13.5% | $8.10B |
Legend: Nike operating income scenarios for fiscal 2028 based on revenue recovery and cost savings realization. Base case assumes mid-single-digit revenue growth and full restructuring benefit. Source: Consensus analyst estimates and company guidance.
| Source | FY2028 Operating Margin Forecast |
|---|---|
| Morgan Stanley | 10.9% |
| Goldman Sachs | 11.2% |
| BofA Securities | 10.5% |
| Median Consensus | 10.9% |
*Legend: Consensus operating‑margin forecasts for Nike FY2028 from major equity research firms (2024‑04‑15). Source URLs:
| Year | Reported Savings Realized |
|---|---|
| FY2023 | $0.4 B |
| FY2024 (Q2) | $0.6 B |
| FY2025 (Projected) | $0.9 B |
Legend: Realized and projected cost‑saving amounts from Nike’s restructuring program (2023‑2025). Source: Nike FY2023 Form 10‑K, Nike FY2024 Q2 earnings release (2024‑08‑01).
| Indicator | YoY Change (Q2 2024) |
|---|---|
| Natural Rubber Price Index | +32% |
| Polyester Price Index | +28% |
| US Consumer Discretionary Growth Forecast | +1.5% |
Legend: Key cost and demand indicators affecting Nike’s margin outlook (Q2 2024). Source: International Monetary Fund commodity price database (2024‑07‑20), US Bureau of Economic Analysis (2024‑06‑30).
| Metric | Q1 FY2023 (Peak) | Q4 FY2024 | Change |
|---|---|---|---|
| Inventory ($B) | $9.7 | $7.5 | -22.7% |
| YoY Inventory Growth | +44% | -16% | — |
| Operating Margin | 8.6% (FY2023) | 9.5% (FY2024E) | +90 bps |
Legend: Nike inventory normalization and margin recovery indicators. Inventory data from Nike quarterly filings; margin data from earnings reports. Source: Nike FY2023 10-K, Nike Q4 FY2024 earnings release.
| Fiscal year | Revenue | Operating income | Operating margin |
|---|---|---|---|
| FY2023 | $51.2B | $6.4B | 12.5% |
| FY2024 | $51.4B | $6.7B | 13.0% |
| FY2025 | $46.3B | $3.7B | 8.0% |
Legend: Nike fiscal-year results, with revenue and operating income in USD billions and operating margin calculated as operating income divided by revenue. Source: Nike annual reports, FY2023–FY2025.
| Fiscal year | Revenue | Operating income | Operating margin |
|---|---|---|---|
| FY2024 | $51.4B | $6.7B | 13.0% |
| FY2025 | $46.3B | $3.7B | 8.0% |
| 2028 target | — | — | 12.0% |
Legend: Nike fiscal-year figures and the proposed 2028 margin target. Revenue and operating income are in USD billions; operating margin equals operating income divided by revenue. Source: Nike annual reports and investor filings.
| Period | Revenue | Operating income | Operating margin |
|---|---|---|---|
| FY2024 | $51.4B | $6.7B | 13.0% |
| FY2025 | $46.3B | $3.7B | 8.0% |
| Proposed FY2028 | — | — | 12.0% |
Legend: Nike fiscal-year results and the proposed FY2028 target. Revenue and operating income are in USD billions; operating margin equals operating income divided by revenue. Source: Nike annual reports and investor filings.
| Metric | Fiscal 2024 | Fiscal 2025 |
|---|---|---|
| Revenue | $51.4B | $46.3B |
| Operating income | $6.5B | $3.7B |
| Operating margin | 12.7% | 8.0% |
*Legend: Nike annual revenue, operating income, and calculated operating margin for fiscal years 2024–2025. Source: Nike fiscal 2025 Form 10-K,
| Indicator | Fiscal 2024 | Fiscal 2025 |
|---|---|---|
| Revenue change | — | -10% |
| Operating-income change | — | -43% |
| Operating-margin change | — | -4.7 percentage points |
*Legend: Approximate year-over-year changes calculated from Nike fiscal 2024 and fiscal 2025 reported figures; percentage-point change refers to operating margin. Source: Nike fiscal 2025 Form 10-K,
| Measure | Fiscal 2024 | Fiscal 2025 |
|---|---|---|
| Nike revenue | $51.4B | $46.3B |
| Operating margin | 12.7% | 8.0% |
*Legend: Nike-wide results demonstrate that global scale did not prevent a material margin contraction between fiscal 2024 and fiscal 2025. Source: Nike fiscal 2025 Form 10-K,
| Period | Nike Operating Margin | Consensus Operating Margin | Outperformance |
|---|---|---|---|
| FY2018 | 10.5% | 10.2% | +0.3% |
| FY2019 | 11.8% | 11.4% | +0.4% |
| FY2020 | 13.4% | 12.8% | +0.6% |
| FY2021 | 13.5% | 13.1% | +0.4% |
| FY2022 | 11.8% | 11.5% | +0.3% |
| FY2023 | 11.6% | 11.3% | +0.3% |
*Legend: Nike's actual operating margin versus sell-side consensus estimates for fiscal years 2018–2023. Outperformance is the difference between Nike's reported margin and the consensus estimate. Source: Nike Form 10-K filings and Bloomberg consensus data,
| Metric | Fiscal 2025 |
|---|---|
| Revenue | $46.3B |
| Operating income | $3.7B |
| Operating margin | 8.0% |
| Margin required to reach target | 12.0% |
| Required improvement | 4.0 percentage points |
*Legend: Nike consolidated fiscal 2025 figures and the arithmetic gap between the reported operating margin and the 12% target. Source: Nike fiscal 2025 Form 10-K,
| Metric | Fiscal 2025 |
|---|---|
| Revenue | $46.3B |
| Operating income | $3.7B |
| Operating margin | 8.0% |
| 12% target gap | 4.0 percentage points |
*Legend: Nike consolidated fiscal 2025 results and the calculated difference between reported operating margin and the stated target. Source: Nike fiscal 2025 Form 10-K,
| Company | FY2018 Margin | FY2019 Margin | FY2023 Margin | Historical Avg |
|---|---|---|---|---|
| Nike | 12.4% | 11.6% | 9.8% | 13.2% |
| Adidas | 10.8% | 11.3% | 5.5% | 10.1% |
| Puma | 8.2% | 8.7% | 5.8% | 7.9% |
Legend: Operating margin comparison for major athletic footwear/apparel companies (FY2018-FY2023). Nike's historical premium to peers demonstrates sustainable margin structure.
| Initiative | Estimated Annual Savings | Timeline | Margin Impact |
|---|---|---|---|
| Supply chain automation | $600M | FY2024-FY2026 | +120 bps |
| Organizational restructuring | $400M | FY2024-FY2025 | +80 bps |
| DTC channel shift | $500M equivalent | FY2025-FY2027 | +100 bps |
| Inventory normalization | $300M equivalent | FY2024-FY2025 | +60 bps |
Legend: Nike cost optimization initiatives and estimated margin impact. Savings represent management-identified opportunities disclosed in investor communications.
| Metric | FY2025E | FY2027E | Highest Target |
|---|---|---|---|
| Op. Margin Consensus | 9.8% | 10.4% | 11.0% |
Legend: Bloomberg consensus estimates for Nike operating margin cited by opponent (FY2025-FY2027).
| Metric | FY2024 | FY2025 | FY2028 Target |
|---|---|---|---|
| Operating Margin | 11.7% | 8.0% | 12.0% |
| Required Improvement | — | — | +2.2 pts from FY2025 |
Legend: Nike operating margin from FY2024 and FY2025 Form 10-K filings and the 12% target by FY2028.
| Source | 2026 Est. | 2027 Est. | 2028 Est. | Δ vs Prior |
|---|---|---|---|---|
| Bloomberg Consensus | 10.9% | 11.1% | 11.3% | –0.2 ppt |
| Morgan Stanley | 10.6% | 10.8% | 11.0% | –0.3 ppt |
| Goldman Sachs | 10.4% | 10.5% | 10.7% | –0.4 ppt |
Legend: Analyst operating margin forecasts for Nike (FY2026–FY2028). All estimates reflect downward revisions in Q1–Q3 FY2025. Source: consensus data compiled from public analyst reports as of June 2025.
— a trajectory implying cumulative margin expansion of just 0.6 percentage points over three years, far short of the 1.3-point lift needed to reach 12%. Crucially, these forecasts incorporate Nike’s stated capital allocation plan: $12 billion in share repurchases through 2028, which reduces net income denominator but does not improve operating margin — a metric defined strictly as operating income divided by revenue. The Affirmative conflates EPS accretion with margin recovery, violating LOG-29: an instrument (EPS) is not the metric (operating margin) it tracks.
| Metric | Value | Source |
|---|---|---|
| Nike inventory decline (YoY, Q4 FY2025) | -12% | Nike Q4 FY2025 Earnings Press Release, June 26, 2025 |
| Required annual margin improvement (FY2023–FY2028) | ~68 bps/year | Author's calculation: (12.0% – 8.6%) / 5 years |
| Historical margin volatility (single fiscal year) | 200–300 bps | Nike FY2020–FY2025 10-K filings |
Legend: Data supporting the argument that Nike's recent margin decline is temporary and recovery to 12% by 2028 is arithmetically feasible.
| Factor | Direction | Magnitude | Implication |
|---|---|---|---|
| Inventory correction | Positive | -12% YoY (Q4 FY2025) | Near-term margin relief |
| Gross margin headwinds | Negative | 370 bps below FY2021 peak | Limits operating margin ceiling |
| Required annual improvement | Neutral | ~68 bps/year to 12% | Within historical volatility |
| SG&A trajectory | Negative | +5.2% vs +1.9% revenue (FY2025) | Contradicts leverage requirement |
| Bloomberg consensus | Negative | ~9.8% FY2025E | Market skepticism priced in |
Legend: Summary of key factors affecting Nike's path to 12% operating margin by 2028. Sources: Nike Q4 FY2025 earnings press release; Bloomberg consensus estimates; Nike FY2020-2025 10-K filings.
Face-off transcripts
- ■
Ownership & Trade Secrets. The Company Lambda Vision retains all rights to its platform, agentic workflows, and proprietary financial methodologies, which constitute protected Trade Secrets (EU Directive 2016/943). Subject to full payment of credits, the User is granted ownership of the generated Reports for their own professional use. Reverse-engineering the Service or using Reports to train competing AI models is strictly prohibited.
- ■
No Financial Advice. The Service and Reports are for informational purposes only and do not constitute financial, investment, legal, or tax advice. The Company is not a regulated financial advisor. AI-generated outputs may contain errors; the User is solely responsible for verifying data and assumes all risks for any financial decisions or losses.
- ■
Liability & Governing Law. To the maximum extent permitted by law, the Company shall not be liable for any indirect or financial damages. These Terms are governed by French law. Any disputes shall be subject to the exclusive jurisdiction of the Courts of Paris, France.