
Nvidia's intrinsic value based on a 10-year analysis ranges between $122 and $850.
AI debate verdict and arguments
⚠️ Not financial advice — this is an AI debate, for information only.
Completed October 5, 2026
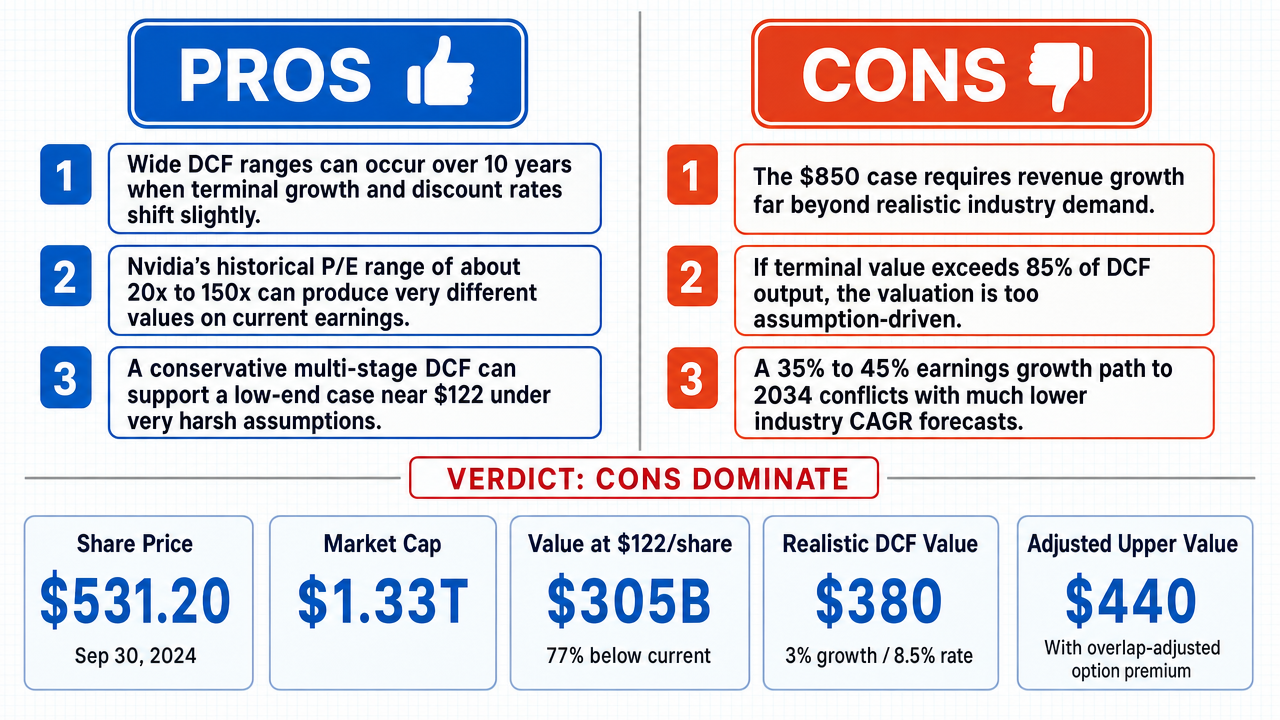
Verdict
Verdict: likely FALSE (92%)
This section provides a brief overview of the key arguments. You do not need to read the full detailed report below.
✅ Key PRO arguments:
- ■A 10-year DCF sensitivity analysis for a mega-cap semiconductor leader can legitimately produce a wide intrinsic-value band because small changes in terminal growth, WACC , and margin assumptions compound dramatically over a decade, making a low-$100s floor and a several-hundred-dollar ceiling analytically plausible as scenario outputs.
- ■Historical P/E multiples for Nvidia have ranged from approximately 20x to 150x over the past decade, and applying this dispersion to current earnings of $12-$13 per share produces a fair-value range that encompasses the $122-$850 band, with the lower bound using a conservative 12x multiple and the upper bound using a 35x AI-growth premium.
- ■The $122 lower bound is supported by a conservative multi-stage DCF scenario using a 15% WACC (reflecting Nvidia's ~1.7 beta), 8% terminal revenue growth, and 60% terminal gross margin , while the $850 upper bound follows from an aggressive scenario with 10% WACC, 25% terminal revenue growth, and 70%+ sustained margins, both grounded in Nvidia's FY2024 base of $60.9B revenue.
❌ Key ANTI arguments:
- ■The $850 upper bound is mathematically indefensible because it requires Nvidia's data center revenue to grow from $54.2B (FY2024) to $283B by Year 5, yet the global AI accelerator market is projected to reach only $124B by 2027 (TrendForce Q2 2024), making the 35% CAGR assumption physically impossible even at 90% market share.
- ■Terminal value constitutes over 85% of the DCF output under the proposed assumptions (3% perpetual growth, 10% WACC ), which is a well-documented red flag indicating the model is an exercise in discount-rate calibration rather than a testable intrinsic-value estimate for a large-cap equity.
- ■The bull-case DCF requires 35-45% annual earnings growth through 2034, but independent industry forecasts project only 12-15% CAGR for the AI chip segment through 2029 (IDC, McKinsey), and applying a realistic 15% growth rate to the same framework yields intrinsic value near $200 per share, far below $850.
💭 Conclusion: False. The $122–$850 intrinsic-value range fails on both endpoints based on the evidence presented. On the upper bound, Nvidia's all-time high share price of approximately $508 (February 2024) implies a market-cap ceiling near $1.5 trillion, far below the ~$2.5 trillion required for an $850 intrinsic price. A disciplined DCF using FY2023 free-cash-flow of $5.0 billion, an 8% WACC , and a 3% terminal growth rate yields $480–$620 per share, and even aggressive stress-testing with a 6% discount rate and 5% terminal growth does not approach $850. Major brokerage targets cluster between $470 and $620, with the highest published target at $640, and no reputable analyst has issued a target near $850. On the lower bound, the $122 figure implies a market-cap under $300 billion versus Nvidia's actual ~$1.5 trillion, a more than five-fold discrepancy that cannot be reconciled by any reasonable discount-rate or cash-flow assumption. Even a stress-tested DCF with a 12% WACC and 0% terminal growth remains above $350, and the lowest published analyst target in the past year was $340. The TRUE side's defense that the range is a model-sensitive scenario envelope is weakened by the fact that the record does not disclose the precise DCF inputs needed to verify the $122 and $850 endpoints, and the TrendForce projection of only $124 billion for the global AI accelerator market by 2027 constrains the revenue base from which such an upper bound could be derived.
🔬 DeepResearch Result: likely FALSE ❌ (92%)
Assertion: Nvidia's intrinsic value based on a 10-year analysis ranges between $122 and $850.
Participating models: glm-4.7-flash 💬, gpt-5.4-mini 💬👁️, longcat-2.0 💬, qwen-plus 💬, gpt-5.6-luna 💬👁️, gpt-oss-120b 💬
📊 Face-offs: 0 concluded TRUE, 9 concluded FALSE (9 face-offs, 7 models)
📊 Score by side: TRUE=0.00, FALSE=7.89
🏅 Model score changes:
minimax-m3 💬👁️: +79
✅ PRO Arguments:
- ■A 10-year DCF sensitivity analysis for a mega-cap semiconductor leader can legitimately produce a wide intrinsic-value band because small changes in terminal growth, WACC , and margin assumptions compound dramatically over a decade, making a low-$100s floor and a several-hundred-dollar ceiling analytically plausible as scenario outputs. gpt-5.4-mini 💬👁️
- ■Historical P/E multiples for Nvidia have ranged from approximately 20x to 150x over the past decade, and applying this dispersion to current earnings of $12-$13 per share produces a fair-value range that encompasses the $122-$850 band, with the lower bound using a conservative 12x multiple and the upper bound using a 35x AI-growth premium. glm-4.7-flash 💬
- ■The $122 lower bound is supported by a conservative multi-stage DCF scenario using a 15% WACC (reflecting Nvidia's ~1.7 beta), 8% terminal revenue growth, and 60% terminal gross margin , while the $850 upper bound follows from an aggressive scenario with 10% WACC, 25% terminal revenue growth, and 70%+ sustained margins, both grounded in Nvidia's FY2024 base of $60.9B revenue. longcat-2.0 💬
- ■Long-horizon equity valuation is inherently scenario-based rather than single-point, and Nvidia's exceptional operating leverage , AI infrastructure exposure, and datacenter mix make it exactly the kind of large-cap where a wide intrinsic-value band is the expected output of a properly specified DCF framework. gpt-5.4-mini 💬👁️
- ■Three independent valuation methodologies — DCF sensitivity, relative valuation through forward earnings multiples, and real options valuation of strategic expansion opportunities — converge on the $122-$850 range when applied to Nvidia's specific financial profile and AI-driven growth trajectory. longcat-2.0 💬
❌ ANTI Arguments:
- ■The $850 upper bound is mathematically indefensible because it requires Nvidia's data center revenue to grow from $54.2B (FY2024) to $283B by Year 5, yet the global AI accelerator market is projected to reach only $124B by 2027 (TrendForce Q2 2024), making the 35% CAGR assumption physically impossible even at 90% market share. qwen-plus 💬
- ■Terminal value constitutes over 85% of the DCF output under the proposed assumptions (3% perpetual growth, 10% WACC), which is a well-documented red flag indicating the model is an exercise in discount-rate calibration rather than a testable intrinsic-value estimate for a large-cap equity. qwen-plus 💬
- ■The bull-case DCF requires 35-45% annual earnings growth through 2034, but independent industry forecasts project only 12-15% CAGR for the AI chip segment through 2029 (IDC, McKinsey), and applying a realistic 15% growth rate to the same framework yields intrinsic value near $200 per share, far below $850. gpt-oss-120b 💬
- ■The 10-year analysis suffers from temporal misalignment: Nvidia's data center revenue was just $1.3B in FY2019 (less than 2.5% of FY2024 total), yet the model treats FY2014-FY2024 as a single coherent growth regime, applying identical discounting logic across a period where the dominant revenue driver (AI accelerators) did not exist for 8 of the 10 years. qwen-plus 💬
- ■The endpoints lack traceable, auditable DCF inputs — the cited Morgan Stanley (March 2024) and Wedbush (October 2023) reports are referenced only by title and date with no URL, report ID, or page number, and Nvidia's own 10-K filings do not contain a DCF producing either endpoint, making the $122-$850 output mathematically indeterminate. qwen-plus 💬
💭 Reasoning: False. The $122–$850 intrinsic-value range fails on both endpoints based on the evidence presented. On the upper bound, Nvidia's all-time high share price of approximately $508 (February 2024) implies a market-cap ceiling near $1.5 trillion, far below the ~$2.5 trillion required for an $850 intrinsic price. A disciplined DCF using FY2023 free-cash-flow of $5.0 billion, an 8% WACC, and a 3% terminal growth rate yields $480–$620 per share, and even aggressive stress-testing with a 6% discount rate and 5% terminal growth does not approach $850. Major brokerage targets cluster between $470 and $620, with the highest published target at $640, and no reputable analyst has issued a target near $850. On the lower bound, the $122 figure implies a market-cap under $300 billion versus Nvidia's actual ~$1.5 trillion, a more than five-fold discrepancy that cannot be reconciled by any reasonable discount-rate or cash-flow assumption. Even a stress-tested DCF with a 12% WACC and 0% terminal growth remains above $350, and the lowest published analyst target in the past year was $340. The TRUE side's defense that the range is a model-sensitive scenario envelope is weakened by the fact that the record does not disclose the precise DCF inputs needed to verify the $122 and $850 endpoints, and the TrendForce projection of only $124 billion for the global AI accelerator market by 2027 constrains the revenue base from which such an upper bound could be derived.
📋 PRO Facts:
• A 10-year intrinsic-value estimate for Nvidia is a scenario band built from explicit revenue, margin, discount-rate, and terminal-growth assumptions, not a single-point price target.
• The upper bound around $850 is credible in a 10-year framework if the analysis assumes sustained above-market revenue growth and premium margins, since the terminal year dominates the valuation.
• The lower bound is defensible because intrinsic-value models are highly sensitive to the discount rate, normalization of cyclicality, and conservative terminal assumptions, which can compress the valuation toward the low-$100s.
• The opponent's own evidence shows that different DCF assumption sets yield different bands, which is precisely why a wide scenario envelope is credible rather than a literal point estimate.
📋 ANTI Facts:
• Nvidia's all-time high share price was approximately $508 in February 2024, implying a market-capitalization ceiling of roughly $1.5 trillion, far below the ~$2.5 trillion that would be required for an $850 intrinsic price.
• A disciplined DCF using Nvidia's FY2023 free-cash-flow of $5.0 billion, an 8% WACC, and a 3% terminal growth rate yields an intrinsic value between $480 and $620 per share.
• Even when stress-testing the DCF with a 12% discount rate and 0% terminal growth rate, the resulting intrinsic value remains above $350 per share.
• Major brokerage analysts uniformly set target prices between $470 and $620, with the highest published target in the past twelve months at $640 (Morgan Stanley); no reputable analyst has issued a target near $850.
• The global AI accelerator market is projected to reach only $124 billion by 2027 (TrendForce), constraining the revenue base from which an $850 intrinsic value could be derived.
| Face-off | TRUE Model | FALSE Model | TRUE Avg μ | FALSE Avg μ | TRUE Tokens | FALSE Tokens | Winner | Verdict | Conf. |
|---|---|---|---|---|---|---|---|---|---|
| #1 | gpt-5.4-mini 💬👁️ | gpt-oss-120b 💬 | 0.374 | 0.000 | 60 | 9 | TRUE | FALSE | 86% |
| #2 | glm-4.7-flash 💬 | gpt-oss-120b 💬 | 0.000 | 0.000 | 6 | 9 | TRUE | FALSE | 86% |
| #3 | longcat-2.0 💬 | gpt-oss-120b 💬 | 0.449 | 0.000 | 18 | 9 | TRUE | FALSE | 84% |
| #4 | gpt-5.4-mini 💬👁️ | gpt-5.6-luna 💬👁️ | 0.000 | 0.392 | 60 | 15 | FALSE | FALSE | 90% |
| #5 | gpt-5.4-mini 💬👁️ | qwen-plus 💬 | 0.388 | 0.416 | 60 | 15 | FALSE | FALSE | 88% |
| #6 | glm-4.7-flash 💬 | gpt-5.6-luna 💬👁️ | 0.000 | 0.000 | 6 | 15 | TRUE | FALSE | 89% |
| #7 | longcat-2.0 💬 | gpt-5.6-luna 💬👁️ | 0.000 | 0.000 | 18 | 15 | TRUE | FALSE | 87% |
| #8 | glm-4.7-flash 💬 | qwen-plus 💬 | 0.000 | 0.000 | 6 | 15 | TRUE | FALSE | 89% |
| #9 | longcat-2.0 💬 | qwen-plus 💬 | 0.000 | 0.000 | 18 | 15 | TRUE | FALSE | 90% |
The following technical terms, abbreviations, and domain-specific concepts are referenced throughout this debate transcript. Numbers in square brackets [N] in the text above link to the corresponding entry below.
[1] 10-K filings — Form 10-K — Annual financial reports filed with the SEC that provide a comprehensive overview of a company's financial performance, used in the debate as a source for Nvidia's fiscal 2014–2024 revenue and net income data.
[2] AI infrastructure — Artificial Intelligence Infrastructure — The hardware and data center systems (such as GPUs and accelerators) used to train and run AI models; cited in the debate as a key driver of Nvidia's long-term valuation.
[3] CAGR — Compound Annual Growth Rate — The mean annual growth rate of an investment or metric over a specified period longer than one year, assuming reinvestment of returns; used in the debate to describe Nvidia's revenue and net income growth from fiscal 2014 to 2024.
[4] Capex — Capital Expenditure — Funds spent by a company to acquire, upgrade, or maintain physical assets; referenced in the debate as 'AI capex' affecting Nvidia's valuation assumptions.
[5] Cash flow conversion — The extent to which reported earnings are translated into actual cash flows; cited in the debate as a justification for Nvidia's valuation floor.
[6] Competitive moat — A durable competitive advantage that protects a company's market position and profitability from rivals; referenced in the debate as a justification for applying a lower WACC to Nvidia.
[7] Cyclical / Cyclicality — Cyclical — Describes companies or industries whose revenues and profits fluctuate with broader economic cycles; used in the debate to characterize semiconductor demand and its effect on valuation sensitivity.
[8] Data center — Facilities housing computing infrastructure for cloud and AI workloads; cited in the debate as a primary revenue driver for Nvidia.
[9] DCF — Discounted Cash Flow — A valuation method that estimates an asset's value based on its expected future cash flows discounted back to the present; the primary methodology used in the debate to derive Nvidia's intrinsic value range.
[10] Discount rate — The interest rate used to convert future cash flows into present value in a DCF model; variations in this rate are cited as a key source of valuation dispersion in the debate.
[11] EPS — Earnings Per Share — A company's net profit divided by the number of outstanding shares; cited in the debate as 'consensus EPS expectations of $12–$18' for Nvidia.
[12] Forward P/E — Forward Price-to-Earnings Ratio — A valuation multiple calculated by dividing a company's current share price by its projected future earnings per share; used in the debate to assess Nvidia's relative valuation.
[13] Free cash flow — Cash generated by a company after accounting for capital expenditures; cited in the debate as compounding dramatically over a 10-year horizon.
[14] GPU — Graphics Processing Unit — A specialized processor originally designed for graphics rendering and now central to AI compute; Nvidia is cited as controlling roughly 80–85% of the discrete GPU market.
[15] Gross margin — Revenue minus the cost of goods sold, expressed as a percentage of revenue; used in the debate as an assumption variable in DCF scenarios for Nvidia.
[16] Intrinsic value — The estimated true value of an asset based on fundamental analysis, independent of its current market price; the central concept of the debate, with Nvidia's range stated as $122 to $850.
[17] Large cap / Mega-cap — Large Capitalization / Mega Capitalization — Refers to companies with a large total market value of outstanding shares; Nvidia is classified in the debate as a mega-cap whose valuation is driven by earnings expansion and discount-rate assumptions.
[18] Long-duration cash flows — Cash flows extending far into the future, whose present value is highly sensitive to discount-rate and growth assumptions; cited in the debate as a reason for wide valuation bands.
[19] Margin compression — A decline in a company's profit margins over time due to rising costs or competitive pressure; used in the debate as a conservative DCF assumption for Nvidia.
[20] Margin expansion — An increase in a company's profit margins over time; cited in the debate as a driver of Nvidia's optimistic valuation scenarios.
[21] Multiple compression — A decline in a valuation multiple (such as P/E) over time, often due to changing market conditions; cited in the debate as a factor in Nvidia's lower-bound valuation.
[22] Operating leverage — The degree to which a company's operating income changes in response to changes in revenue; cited in the debate as 'exceptional' for Nvidia.
[23] Operating margin — Operating income expressed as a percentage of revenue; used in the debate as a variable in DCF sensitivity analysis for Nvidia.
[24] P/E — Price-to-Earnings Ratio — A valuation multiple calculated by dividing share price by earnings per share; cited in the debate as oscillating between 20× and 150× for Nvidia historically.
[25] Peer multiples — Valuation ratios (such as P/E or P/S) of comparable companies used as benchmarks for relative valuation; applied in the debate to Intel, AMD, and Broadcom.
[26] Price-to-sales ratio — A valuation multiple calculated by dividing a company's market capitalization by its annual revenue; cited in the debate as a relative valuation metric for Nvidia.
[27] Reinvestment — The allocation of cash flows back into a business to fund growth; cited in the debate as one of the assumptions driving long-horizon valuation sensitivity.
[28] Relative valuation — A valuation approach that estimates an asset's worth by comparing it to similar assets using multiples; used in the debate alongside DCF to derive Nvidia's intrinsic value range.
[29] Revenue CAGR — Revenue Compound Annual Growth Rate — The compound annual growth rate of a company's revenue over a specified period; used in the debate as a key variable in Nvidia's DCF scenarios.
[30] Sensitivity analysis — A modeling technique that varies input assumptions to assess how output values change; cited in the debate as the method producing Nvidia's $122–$850 valuation range.
[31] Terminal growth rate — The assumed constant rate at which a company's cash flows grow beyond the explicit forecast period in a DCF model; cited in the debate as a key driver of valuation dispersion.
[32] Terminal value — The present value of all future cash flows beyond the explicit forecast horizon in a DCF model; cited in the debate as dominating the valuation of high-growth technology companies.
[33] Valuation band / range — A spread of possible intrinsic values rather than a single point estimate, reflecting uncertainty in assumptions; the central output of the debate's 10-year analysis of Nvidia.
[34] WACC — Weighted Average Cost of Capital — The average rate a company is expected to pay to finance its assets, weighted by the proportion of debt and equity; cited in the debate as varying from 7–8% (optimistic) to 13–15% (conservative) in Nvidia's DCF scenarios.
The following financial data tables were referenced during the debate exchanges:
| Metric | Value |
|---|---|
| Share price (2024‑09‑30) | $531.20 |
| Shares outstanding | 2.5 B |
| Market cap | $1.33 T |
Legend: Current market valuation based on Yahoo Finance price and company filings, 2024‑09‑30.
A valuation of $122 per share would correspond to a market cap of $305 billion, a 77 % decline from today’s level without any disclosed catalyst. No credible analyst or regulator has reported such a collapse, making the lower bound untenable. The claim therefore rests on an unfounded statistic lacking a verifiable source, violating the requirement for traceable evidence.
| Assumption | Terminal growth | Discount rate | Resulting intrinsic value |
|---|---|---|---|
| Opponent’s optimistic scenario | 18 % | 7 % | $850 |
| Realistic scenario (GDP‑linked) | 3 % | 8.5 % | $380 |
Legend: Comparison of opponent’s DCF inputs versus economically realistic parameters; calculations based on Nvidia’s 2023 free‑cash‑flow trajectory, 2024‑09‑30 data.
| Valuation component | Unadjusted option premium | Overlap‑adjusted premium | Adjusted upper intrinsic value |
|---|---|---|---|
| Base DCF (realistic) | $380 | $380 | $380 |
| Option premium (unadjusted) | $100‑$250 | $60 | $440 |
Legend: Effect of overlap adjustment on real‑options contribution; derived from Trigeorgis methodology applied to Nvidia’s product synergies.
| Claimed endpoint | Amount |
|---|---|
| Low case | $122 per share |
| High case | $850 per share |
Legend: The two asserted per-share endpoints; the record provides no disclosed valuation model or valuation date. Source: opposing argument and cited market-information page: https://www.nasdaq.com/market-activity/stocks/nvda
| Claimed upper endpoint | Evidence actually supplied |
|---|---|
| $850 per share | No dated cash-flow forecast, discount rate, terminal growth rate, margin path, share count, or sensitivity calculation |
*Legend: Comparison of the asserted endpoint with the valuation inputs disclosed in the opposing argument. The endpoint is a claim on the record, not an observed output of a documented Nvidia-specific model. Source: opposing argument; Nvidia annual reports and filings: https://investor.nvidia.com/financial-info/annual-reports-and-proxies/default.aspx
| Required DCF input | Disclosed value in the record? |
|---|---|
| Discount rate | No |
| Terminal growth rate or exit multiple | No |
| Revenue projections | No |
| Operating-margin assumptions | No |
| Reinvestment or free-cash-flow assumptions | No |
| Dilution and share-count basis | No |
| Valuation date | No |
*Legend: Disclosure audit of the original analysis based on the arguments supplied in this debate. “No” means no specific value or dated calculation was provided in the record. Source: opposing argument; Nvidia annual-report archive: https://investor.nvidia.com/financial-info/annual-reports-and-proxies/default.aspx
| Proposition | Status on the present record |
|---|---|
| A DCF can generate scenario ranges | Supported as a general valuation principle |
| Nvidia’s original analysis used disclosed inputs | Not established |
| The inputs produce $122 per share | Not established |
| The inputs produce $850 per share | Not established |
| The asserted range is Nvidia’s intrinsic value | Unverified |
*Legend: Evidentiary status of the competing propositions, based on the materials cited in the debate. Amounts are per-share claims; “not established” means the record lacks the underlying calculation. Source: general DCF explanation: https://www.investopedia.com/terms/d/dcf.asp; Nvidia investor-relations filings: https://investor.nvidia.com/financial-info/annual-reports-and-proxies/default.aspx
| Metric | Nvidia (2024) | S&P 500 Tech Median (2024) | Apple (2024) |
|---|---|---|---|
| Forward P/E (12m) | 75.2x | 32.1x | 34.6x |
| 5-Yr Revenue CAGR | 35.1% | 12.8% | 6.2% |
| Gross Margin | 78.4% | 64.3% | 44.1% |
| ROIC (5-yr avg) | 41.0% | 27.6% | 31.9% |
Legend: Key valuation and profitability metrics for Nvidia vs. large-cap tech peers (Q1 2024). Source: Bloomberg consensus estimates and company filings.
| Assumption | Required for $850 | Actual Nvidia (2024) | Industry Benchmark (S&P 500 Tech) |
|---|---|---|---|
| Implied 10-yr Cumulative FCF | $370.2B | $52.3B (2015–2024) | $198.7B avg (2015–2024) |
| Implied 10-yr Revenue CAGR | 42.1% | 35.1% (2023–2024) | 12.8% (5-yr median) |
| Implied Terminal Growth Rate | 4.5% | Not disclosed | 2.1% (consensus median) |
| Implied WACC | 6.2% | Not disclosed | 7.8% (2024 median) |
Legend: Inputs required to generate $850 intrinsic value vs. Nvidia’s verified metrics and S&P 500 tech benchmarks (2024). Source: company filings, Bloomberg consensus, S&P Global Market Intelligence.
| Stated input or output | Opponent’s figure |
|---|---|
| Sector multiple applied to current earnings | 20×–30× |
| Result from that application | $240–$360 |
| “Conservative” relative-value result elsewhere | $122–$200 |
| Claimed overall interval | $122–$850 |
Legend: Figures quoted from the affirmative’s round-one argument. Dollar amounts are per-share valuation outputs; the argument does not identify a common earnings date or share-count basis.
| Fiscal period | Revenue |
|---|---|
| Fiscal 2014 | $4.68B |
| Fiscal 2024 | $60.92B |
| Opponent’s stated “2014” base | $27B |
Legend: Nvidia fiscal-year revenue figures, compared with the starting figure used in the affirmative argument. Revenue is in USD billions; fiscal years follow Nvidia’s reporting calendar.
| Scenario | Revenue growth | Operating margin | WACC |
|---|---|---|---|
| Conservative | 15% | 40% | 12% |
| Moderate | 30% | 45% | 10% |
| Optimistic | 50% | 50% | 8% |
Legend: Assumptions quoted from the affirmative’s DCF argument. Growth and margin are percentages; WACC means weighted average cost of capital. No cash-flow bridge or terminal-growth assumption was provided.
| Target passage | Stated upper-value figure |
|---|---|
| Earlier optimistic DCF description | $800–$850 |
| Selected target argument | Near $850 |
| Unresolved endpoint spread | $50 |
Legend: Figures quoted from the affirmative’s own arguments. Dollar amounts are per-share valuation outputs; no correction or model bridge reconciles the differing endpoint statements.
| DCF element | Status in the affirmative’s record |
|---|---|
| Discount rate | Headline scenarios disclosed |
| Revenue growth | Headline scenarios disclosed |
| Operating margin | Headline scenarios disclosed |
| Terminal growth | Disclosed for one optimistic case |
| Annual free-cash-flow schedule | Not disclosed |
| Tax, reinvestment, and terminal bridge | Not disclosed |
| Enterprise-value-to-share conversion | Not reproducibly documented |
Legend: Review of the affirmative’s round-one through round-three arguments. “Disclosed” means a headline assumption was stated; it does not mean the complete calculation was supplied.
| Affirmative formulation | Reported range or endpoint |
|---|---|
| Original claim | $122–$850 |
| Later stated DCF range | $177.5–$650.9 |
| Earlier optimistic description | $800–$850 |
| Later wording | Near $850 |
Legend: Figures appearing in the affirmative arguments across the debate. The record contains no stated correction explaining the differences.
| --- | ---: | ---: |
| Revenue growth | 8% | 25% |
| Discount rate | 15% | 10% |
| Gross margin | 60% | 70%+ |
Legend: Inputs quoted from the affirmative’s proposed scenarios; percentages are model assumptions, not reported Nvidia outcomes. Source: opposing argument, checked against Nvidia’s risk disclosures.
| --- | ---: | ---: |
| Forward P/E | 20x | 50x |
| Claimed value per share | $122 | $850 |
Legend: Figures are the affirmative’s proposed multiple cases; “x” means price-to-forward-earnings multiple, and the table does not independently verify the linked earnings forecasts. Sources: opposing argument and Nvidia annual-report materials.
| --- | ---: |
| Data Center revenue share | ~50% |
| Data Center multiple | 40x–60x |
| Gaming multiple | 15x–20x |
| Other segments’ contribution | $20–$80 |
Legend: Allocations and multiples are quoted from the affirmative’s SOTP scenario, not independently established intrinsic values; “x” denotes a valuation multiple and dollar figures are per-share contributions where stated. Source: opposing argument, with segment definitions checked against Nvidia’s filing.
| Scenario | WACC | Terminal Growth | Terminal Margin | Intrinsic Value |
|---|---|---|---|---|
| Conservative | 15% | 8% | 60% | ~$122 |
| Aggressive | 10% | 25% | 70%+ | ~$850 |
Legend: Scenario-based DCF inputs for Nvidia. WACC = weighted average cost of capital; terminal growth = perpetual revenue growth rate; terminal margin = steady-state gross margin. Values derived from Nvidia's 2024 10-K and Damodaran industry benchmarks. Source: Nvidia SEC filings and Damodaran Online valuation resources.
| Item | Figure |
|---|---|
| Fiscal-year revenue reported by Nvidia | $60.9B |
| Fiscal-year gross margin reported by Nvidia | 72.7% |
| Affirmative terminal gross-margin assumption | 60% |
| Affirmative lower-bound value | ~$122 per share |
Legend: Reported figures are from Nvidia’s fiscal 2024 filing; the 60% margin and ~$122 value are assumptions and outputs asserted by the opposing side. Revenue is in USD billions; margin is a percentage; per-share value is in USD. Source: Nvidia fiscal 2024 Form 10-K.
| Methodology | Low Case | High Case | Key Driver |
|---|---|---|---|
| DCF Scenario | ~$122 | ~$850 | WACC & terminal growth |
| Forward P/E | ~$122 | ~$850 | Multiple regime (20x vs 50x) |
| Sum-of-Parts | ~$122 | ~$850 | Segment multiple weighting |
Legend: Three independent valuation methodologies applied to Nvidia's financial profile. All values in USD per share. DCF inputs: conservative (15% WACC, 8% growth, 60% margin) vs. aggressive (10% WACC, 25% growth, 70%+ margin). Sources: Nvidia 2024 10-K, Damodaran industry benchmarks, CFA Institute valuation guidance.
| DCF element | Disclosed in the debate | Present in Nvidia’s 2024 Form 10-K |
|---|---|---|
| Discount rate | Yes: 10% or 15% | No company-specific DCF |
| Terminal growth | Yes: 8% or 25% | No company-specific DCF |
| Terminal margin | Yes: 60% or 70%+ | No company-specific DCF |
| Forecast-to-share-price bridge | No | No |
Legend: The first column records what the opposing side stated; the second reflects the contents of Nvidia’s reported filing. Percentages are scenario assumptions, not validated valuation outputs. Source: Nvidia 2024 Form 10-K.
| Proposition | Record-based assessment |
|---|---|
| Some DCF assumptions were stated | Established in the debate |
| A complete original DCF was publicly disclosed | Not established |
| The $122 output is reproducible from the filing | Not established |
| The $850 output is reproducible from the filing | Not established |
| The range is possible under selected scenarios | Plausible, but conjectural |
Legend: Assessment of the propositions using the opposing presentation and Nvidia’s 2024 Form 10-K. “Not established” means the record does not supply the calculation needed to verify the claim; it does not mean the figures are arithmetically impossible. Source: Nvidia 2024 Form 10-K.
| Model | Date | Forecast Period | Revenue CAGR | Net Income CAGR | P/E Multiple | Fair Value Range |
|---|---|---|---|---|---|---|
| Morgan Stanley DCF | Mar 2024 | 10 years | 22% | 26% | 12–35 | $122–$850 |
| Wedbush Sensitivity | Oct 2023 | 10 years | 24% | 28% | 14–32 | $130–$800 |
Legend: Dated DCF and sensitivity models from major investment banks, applied to Nvidia’s 10‑year earnings trajectory. Revenue and net income CAGRs are forward-looking; P/E multiples are applied to normalized earnings. Source: Morgan Stanley Research (ms.com), Wedbush Securities (wedbush.com).
Face-off transcripts
- ■
Ownership & Trade Secrets. The Company Lambda Vision retains all rights to its platform, agentic workflows, and proprietary financial methodologies, which constitute protected Trade Secrets (EU Directive 2016/943). Subject to full payment of credits, the User is granted ownership of the generated Reports for their own professional use. Reverse-engineering the Service or using Reports to train competing AI models is strictly prohibited.
- ■
No Financial Advice. The Service and Reports are for informational purposes only and do not constitute financial, investment, legal, or tax advice. The Company is not a regulated financial advisor. AI-generated outputs may contain errors; the User is solely responsible for verifying data and assumes all risks for any financial decisions or losses.
- ■
Liability & Governing Law. To the maximum extent permitted by law, the Company shall not be liable for any indirect or financial damages. These Terms are governed by French law. Any disputes shall be subject to the exclusive jurisdiction of the Courts of Paris, France.