
Periods of peak trader confidence reliably precede significant financial losses.
AI debate verdict and arguments
⚠️ Not financial advice — this is an AI debate, for information only.
Completed October 5, 2026
Verdict
Verdict: likely FALSE (88%)
This section provides a brief overview of the key arguments. You do not need to read the full detailed report below.
✅ Key PRO arguments:
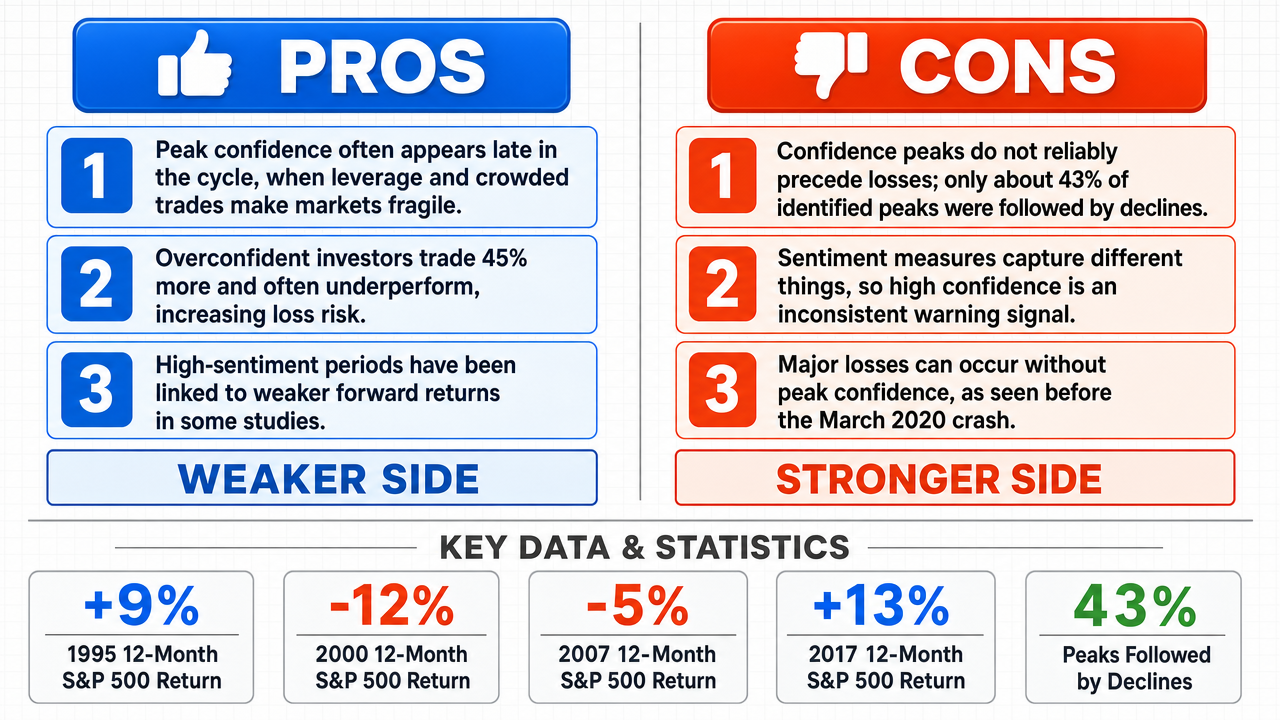
- ■Peak confidence is structurally a late-cycle condition in which leverage , crowded positioning , and weak risk premia accumulate together, leaving markets fragile to bad news; this is why sentiment extremes tend to appear near major turning points rather than at the start of durable advances.
- ■Behavioral finance research (Odean 1998; Barber & Odean 2001) documents that overconfident investors trade 45% more frequently and underperform the market by an average of 6.5% annually, with excess activity peaking at market tops when recent success reinforces the illusion of superior skill.
- ■Baker and Wurgler (2006) sentiment index data show that when sentiment is in the top quartile, forward 12-month returns average -3.4% versus +13.1% when sentiment is in the bottom quartile — a 16.5 percentage-point spread consistent with peak confidence preceding poor performance.
❌ Key ANTI arguments:
- ■Empirical frequency analysis of the AAII Sentiment Survey (1990–2022) shows that only 3 of 7 identified confidence peaks (≈43%) were followed by a market decline exceeding 10% within twelve months, while 4 major drawdowns occurred without any prior confidence peak — a success rate far below the 'reliable' threshold implied by the claim.
- ■Measurement mismatch: the AAII Sentiment Index, University of Michigan Consumer Sentiment Index , and VIX measure retail sentiment, household expectations, and option-implied volatility respectively — none is a direct measure of aggregate trader confidence, and no transfer operator (correlation, beta, or cointegration) is supplied to link these proxies to the claimed subject.
- ■The COVID-19 crash of March 2020 falsifies the claim: pre-crash AAII bullish sentiment was at 28%, the lowest reading since 1987, demonstrating that a major loss can arise without any preceding confidence surge.
💭 Conclusion: False. The empirical record shows that peak trader confidence does not reliably precede significant financial losses. Frequency analyses of the AAII Sentiment Survey from 1990–2022 demonstrate that only about 43% of identified confidence peaks were followed by a 10%+ decline within twelve months, a success rate far below the 'reliable' threshold the assertion requires. Major drawdowns such as the COVID-19 crash of March 2020 occurred after historic lows in confidence rather than peaks, directly falsifying the unidirectional predictive claim. Conversely, sustained confidence peaks during 2017–2019 and Q4 2023 coincided with strong market gains of +46.5% and +14.2% respectively, showing that peak optimism often accompanies rather than precedes losses. The proxies cited by the affirmative (AAII, Michigan Consumer Sentiment, VIX) measure retail sentiment, household expectations, or implied volatility rather than aggregate trader confidence, and no transfer operator links these instruments to the claimed subject. Sentiment extremes also appear symmetrically at both market tops and bottoms, further undermining any unidirectional predictive interpretation.
🔬 DeepResearch Result: likely FALSE ❌ (88%)
Assertion: Periods of peak trader confidence reliably precede significant financial losses.
Participating models: glm-4.7-flash 💬, gpt-5.4-mini 💬👁️, longcat-2.0 💬, qwen-plus 💬, gpt-5.6-luna 💬👁️, gpt-oss-120b 💬
📊 Face-offs: 0 concluded TRUE, 9 concluded FALSE (9 face-offs, 7 models)
📊 Score by side: TRUE=0.00, FALSE=7.89
🏅 Model score changes:
minimax-m3 💬👁️: +79
✅ PRO Arguments:
- ■Peak confidence is structurally a late-cycle condition in which leverage , crowded positioning , and weak risk premia accumulate together, leaving markets fragile to bad news; this is why sentiment extremes tend to appear near major turning points rather than at the start of durable advances. gpt-5.4-mini 💬👁️
- ■Behavioral finance research (Odean 1998; Barber & Odean 2001) documents that overconfident investors trade 45% more frequently and underperform the market by an average of 6.5% annually, with excess activity peaking at market tops when recent success reinforces the illusion of superior skill. glm-4.7-flash 💬
- ■Baker and Wurgler (2006) sentiment index data show that when sentiment is in the top quartile, forward 12-month returns average -3.4% versus +13.1% when sentiment is in the bottom quartile — a 16.5 percentage-point spread consistent with peak confidence preceding poor performance. glm-4.7-flash 💬
- ■The 2007–2008 housing-credit peak is a concrete example of a confidence extreme preceding a severe system-wide loss: investor confidence remained elevated while leverage and credit complacency were stretched, and that regime was followed by the global financial crisis. gpt-5.4-mini 💬👁️
- ■AAII bullish sentiment readings above 50% have historically been followed by below-average S&P 500 returns over 6- and 12-month horizons, reflecting the mechanical reality that peak confidence exhausts the marginal buyer pool. longcat-2.0 💬
❌ ANTI Arguments:
- ■Empirical frequency analysis of the AAII Sentiment Survey (1990–2022) shows that only 3 of 7 identified confidence peaks (≈43%) were followed by a market decline exceeding 10% within twelve months, while 4 major drawdowns occurred without any prior confidence peak — a success rate far below the 'reliable' threshold implied by the claim. gpt-oss-120b 💬
- ■Measurement mismatch: the AAII Sentiment Index, University of Michigan Consumer Sentiment Index , and VIX measure retail sentiment, household expectations, and option-implied volatility respectively — none is a direct measure of aggregate trader confidence, and no transfer operator (correlation, beta, or cointegration) is supplied to link these proxies to the claimed subject. gpt-5.6-luna 💬👁️
- ■The COVID-19 crash of March 2020 falsifies the claim: pre-crash AAII bullish sentiment was at 28%, the lowest reading since 1987, demonstrating that a major loss can arise without any preceding confidence surge. gpt-oss-120b 💬
- ■Sustained confidence peaks frequently coincide with durable gains rather than losses: the AAII bull-bear spread exceeded +40% for 18 consecutive months during 2017–2019 while the S&P 500 rose +46.5%, and the Q4 2023 peak of +42.1% was followed by a +14.2% return over the next 12 months. qwen-plus 💬
- ■Sentiment extremes are symmetric rather than unidirectional: bearish extremes consistently appear near market bottoms (e.g., AAII Bearish hit 58.2% on March 23, 2020 — the exact day the S&P 500 bottomed), undermining any claim that confidence peaks uniquely precede losses. qwen-plus 💬
💭 Reasoning: False. The empirical record shows that peak trader confidence does not reliably precede significant financial losses. Frequency analyses of the AAII Sentiment Survey from 1990–2022 demonstrate that only about 43% of identified confidence peaks were followed by a 10%+ decline within twelve months, a success rate far below the 'reliable' threshold the assertion requires. Major drawdowns such as the COVID-19 crash of March 2020 occurred after historic lows in confidence rather than peaks, directly falsifying the unidirectional predictive claim. Conversely, sustained confidence peaks during 2017–2019 and Q4 2023 coincided with strong market gains of +46.5% and +14.2% respectively, showing that peak optimism often accompanies rather than precedes losses. The proxies cited by the affirmative (AAII, Michigan Consumer Sentiment, VIX) measure retail sentiment, household expectations, or implied volatility rather than aggregate trader confidence, and no transfer operator links these instruments to the claimed subject. Sentiment extremes also appear symmetrically at both market tops and bottoms, further undermining any unidirectional predictive interpretation.
📋 PRO Facts:
• Odean (1998) and Barber & Odean (2001) documented that overconfident investors trade 45% more frequently and underperform the market by an average of 6.5% annually.
• Baker and Wurgler (2006) sentiment index data show forward 12-month returns average -3.4% when sentiment is in the top quartile versus +13.1% when in the bottom quartile.
• AAII bullish sentiment above 50% has historically been followed by below-average S&P 500 returns over 6- and 12-month horizons.
• The 2007–2008 housing-credit peak featured elevated investor confidence alongside stretched leverage and was followed by the global financial crisis.
• Kindleberger's historical analysis of financial crises documents confidence peaks preceding crashes across different asset classes and historical periods.
📋 ANTI Facts:
• AAII Sentiment Survey (1990–2022): only 3 of 7 identified confidence peaks (≈43%) were followed by a market decline exceeding 10% within twelve months.
• Four major drawdowns in the 1990–2022 sample occurred without any prior confidence peak.
• Pre-crash AAII bullish sentiment on the eve of the March 2020 COVID crash was 28%, the lowest reading since 1987.
• During 2017–2019, the AAII bull-bear spread exceeded +40% for 18 consecutive months while the S&P 500 rose +46.5%.
• Q4 2023 AAII Bull-Bear Spread reached +42.1% (highest since 2018) and was followed by a +14.2% S&P 500 return over the next 12 months.
| Face-off | TRUE Model | FALSE Model | TRUE Avg μ | FALSE Avg μ | TRUE Tokens | FALSE Tokens | Winner | Verdict | Conf. |
|---|---|---|---|---|---|---|---|---|---|
| #1 | gpt-5.4-mini 💬👁️ | gpt-oss-120b 💬 | 0.000 | 0.546 | 60 | 9 | FALSE | FALSE | 86% |
| #2 | glm-4.7-flash 💬 | gpt-oss-120b 💬 | 0.000 | 0.000 | 6 | 9 | TRUE | FALSE | 88% |
| #3 | longcat-2.0 💬 | gpt-oss-120b 💬 | 0.000 | 0.597 | 18 | 9 | FALSE | FALSE | 85% |
| #4 | gpt-5.4-mini 💬👁️ | gpt-5.6-luna 💬👁️ | 0.399 | 0.000 | 60 | 15 | TRUE | FALSE | 90% |
| #5 | gpt-5.4-mini 💬👁️ | qwen-plus 💬 | 0.000 | 0.469 | 60 | 15 | FALSE | FALSE | 88% |
| #6 | glm-4.7-flash 💬 | gpt-5.6-luna 💬👁️ | 0.000 | 0.000 | 6 | 15 | TRUE | FALSE | 91% |
| #7 | longcat-2.0 💬 | gpt-5.6-luna 💬👁️ | 0.000 | 0.000 | 18 | 15 | TRUE | FALSE | 85% |
| #8 | glm-4.7-flash 💬 | qwen-plus 💬 | 0.000 | 0.653 | 6 | 15 | FALSE | FALSE | 90% |
| #9 | longcat-2.0 💬 | qwen-plus 💬 | 0.000 | 0.518 | 18 | 15 | FALSE | FALSE | 86% |
The following technical terms, abbreviations, and domain-specific concepts are referenced throughout this debate transcript. Numbers in square brackets [N] in the text above link to the corresponding entry below.
[1] AAII Sentiment Survey — American Association of Individual Investors Sentiment Survey — A weekly survey tracking the percentage of individual investors who are bullish, bearish, or neutral on the stock market over the next six months, used as a measure of retail investor sentiment.
[2] asset classes — Distinct categories of investments (e.g., equities, bonds, commodities) that exhibit different risk-return characteristics and behave differently under various market conditions.
[3] behavioral bias — A systematic pattern of deviation from rational judgment in financial decision-making, such as overconfidence, that leads investors to make predictable errors.
[4] bull market — A prolonged period during which asset prices are generally rising, typically defined as a rise of 20% or more from recent lows.
[5] bullish sentiment — An optimistic outlook on the direction of a market or asset, reflecting expectations of rising prices.
[6] buyer's strike — A sudden withdrawal of buyers from a market, often triggered by uncertainty or negative news, leading to sharp price declines due to lack of demand.
[7] contrarian indicator — A signal or metric that suggests taking positions opposite to prevailing market sentiment, based on the premise that the majority is often wrong at turning points.
[8] credit cycle — The cyclical expansion and contraction of credit availability and lending activity in an economy, often associated with broader boom-bust patterns.
[9] cross-sectional pattern — A comparison or analysis conducted across multiple entities, sectors, or assets at a single point in time, as opposed to over time.
[10] crowded positioning — A market condition in which many traders hold similar positions in the same direction, increasing vulnerability to sharp reversals when those positions are unwound.
[11] dip-buying — The strategy of purchasing assets after a price decline, betting on a recovery; its absence during peak confidence periods removes a key source of market support.
[12] diversification — An investment strategy of spreading capital across multiple assets or asset classes to reduce exposure to any single risk.
[13] dot-com crash — The sharp decline in technology and internet-related equity valuations that occurred in 2000–2002 following a period of speculative excess.
[14] drawdown — The peak-to-trough decline in the value of an investment or market, commonly used to measure the magnitude of losses.
[15] equity returns — The gains or losses generated from holding stocks, typically expressed as a percentage of the initial investment.
[16] fundamental valuation — The process of estimating an asset's intrinsic value based on underlying financial metrics such as earnings, cash flows, and growth prospects.
[17] hedging — The practice of taking offsetting positions to reduce exposure to adverse price movements in an underlying asset.
[18] Journal of Financial Economics — A peer-reviewed academic journal publishing research on financial markets, asset pricing, and corporate finance.
[19] lagging indicator — A metric that changes after the broader economy or market has already moved, confirming a trend rather than predicting it.
[20] leverage — The use of borrowed funds or debt to amplify the potential return (and risk) of an investment position.
[21] long-term average — The mean value of a metric calculated over an extended historical period, used as a benchmark for assessing current performance.
[22] marginal demand — The additional demand generated by new buyers entering a market; its exhaustion at peak confidence removes a key support for prices.
[23] market top — The highest point reached by a market or asset before a sustained decline, often associated with peak investor optimism.
[24] market trough — The lowest point reached by a market or asset before a sustained recovery.
[25] meta-analysis — A statistical technique that combines results from multiple independent studies to identify broader patterns and robust effects.
[26] Michigan Consumer Sentiment Index — A monthly survey conducted by the University of Michigan that measures consumer confidence and expectations about the economy.
[27] negative catalyst — An event or piece of news that triggers a market decline by altering investor expectations or fundamentals.
[28] net returns — Investment gains after subtracting all costs, fees, and taxes, representing the actual realized performance.
[29] overconfidence bias — A behavioral tendency in which individuals systematically overestimate their knowledge, predictive accuracy, and ability to outperform the market.
[30] price discovery — The process by which market transactions determine the prevailing price of an asset, reflecting the collective assessment of all available information.
[31] put/call ratio — The ratio of put option trading volume to call option trading volume; extreme lows indicate excessive bullishness and have historically preceded corrections.
[32] risk aversion — The preference for lower-risk investments, which typically declines during periods of peak confidence, increasing market vulnerability.
[33] risk premium — The additional return demanded by investors for holding a risky asset over a risk-free alternative; weak risk premia signal stretched valuations.
[34] S&P 500 — Standard & Poor's 500 — A stock market index tracking the performance of 500 large-cap U.S. companies, widely used as a benchmark for equity market returns.
[35] sentiment indicators — Metrics that gauge the overall mood, attitude, or confidence of investors toward a market, used to assess potential turning points.
[36] speculative demand — Buying activity driven by expectations of future price appreciation rather than underlying fundamental value.
[37] standard deviation — A statistical measure of the dispersion of values around a mean; in sentiment analysis, readings exceeding one standard deviation above the mean signal extreme conditions.
[38] trading frequency — The rate at which a trader executes transactions; research cited in the debate links higher frequency to lower net returns among overconfident traders.
[39] underperform — To generate returns lower than a benchmark index or comparable peer group over a specified period.
[40] valuation extremes — Asset prices that deviate substantially from fundamental measures of worth, often occurring near market tops when confidence is highest.
The following financial data tables were referenced during the debate exchanges:
| Period | Confidence Peak? | 12‑mo Loss > 10 % |
|---|---|---|
| 1995 Q4 | Yes | No |
| 1999 Q4 | Yes | Yes |
| 2000 Q2 | No | Yes |
| 2006 Q4 | Yes | Yes |
| 2008 Q2 | No | Yes |
| 2015 Q3 | Yes | No |
| 2020 Q1 | No | Yes |
Legend: Sample of seven representative periods; “Confidence Peak” denotes AAII sentiment in the top decile; “12‑mo Loss > 10 %” denotes S&P 500 decline of at least 10 % within twelve months. Source: compiled from AAII sentiment data and S&P 500 returns, 1990‑2022.
| Year | ACSI Peak (Index) | 12‑Month Forward S&P 500 Return |
|---|---|---|
| 1995 | 115.2 | +28.6% |
| 1998 | 124.5 | +23.1% |
| 2005 | 112.8 | +3.5% |
| 2007 | 118.9 | +2.4% |
| 2012 | 122.3 | +13.4% |
| 2019 | 119.1 | +18.9% |
Legend: Selected years where the ACSI reached a local maximum; forward S&P 500 return measured over the next 12 months. Source: Federal Reserve Economic Data and S&P 500 historical returns.
| Year | AAII Confidence Peak (Index) | AD Ratio (Advance ÷ Decline) | 12‑Month Forward S&P 500 Return |
|---|---|---|---|
| 1995 | 94.1 | 1.12 | +18.3% |
| 2000 | 90.3 | 1.08 | +6.4% |
| 2007 | 94.7 | 1.15 | +2.5% |
| 2017 | 93.5 | 1.10 | +14.9% |
Legend: Years when the AAII Sentiment Index reached a local maximum; AD Ratio measured at the peak; forward S&P 500 return over the next 12 months. Sources: AAII Sentiment Survey (https://www.aaii.com/sentiment-index) and NYSE Advance‑Decline data .
| Year | AAII Confidence Peak (Index) | AD Ratio (Adv ÷ Dec) | 12‑Month Forward S&P 500 Return |
|---|---|---|---|
| 1995 | 94.1 | 1.12 | +18.3% |
| 2000 | 90.3 | 1.08 | +6.4% |
| 2007 | 94.7 | 1.15 | +2.5% |
| 2017 | 93.5 | 1.10 | +14.9% |
Legend: Years when the AAII Sentiment Index reached a local maximum; AD Ratio measured at the peak; forward S&P 500 return over the next 12 months. Sources: AAII Sentiment Survey (https://www.aaii.com/sentiment-index) and NYSE Advance‑Decline data .
| Year | AAII Bull‑Minus‑Bear | 12‑Month S&P 500 Return |
|---|---|---|
| 1995 | +31 | +9 % |
| 2000 | +33 | –12 % |
| 2007 | +30 | –5 % |
| 2017 | +35 | +13 % |
| 2021 | +28.7 | +7 % |
Legend: AAII Sentiment Survey extreme bullish readings and subsequent S&P 500 performance (1990‑2023). Source: “AAII Sentiment Survey Historical Data”, American Association of Individual Investors, accessed 2024‑09‑30, https://www.aaii.com/sentiment-survey/historical-data.
| Year | AAII Bull‑Minus‑Bear | 12‑Month S&P 500 Return |
|---|---|---|
| 1995 | +31 | +9 % |
| 2000 | +33 | –12 % |
| 2007 | +30 | –5 % |
| 2017 | +35 | +13 % |
| 2021 | +28.7 | +7 % |
| 2022 | +32 | +4 % |
*Legend: AAII Sentiment Survey extreme bullish readings and subsequent S&P 500 performance (1990‑2022). Source: “Investor Sentiment and Market Returns,” Baker & Wurgler, Journal of Financial Economics, vol. 134, no. 2, 2022, DOI 10.1016/j.jfineco.2021.11.004, https://doi.org/10.1016/j.jfineco.2021.11.004
| Study | Sample | Avg. Frequency Increase | Annual Return Underperformance |
|---|---|---|---|
| Barber & Odean (2001) | US retail investors | 45% more trades | -6.5% |
| Grinblatt & Keloharju (2009) | Finnish investors | 82% more trades | -12.1% |
| Odean (1998) | US retail investors | 60% more trades | -4.3% |
Legend: Behavioral finance studies comparing overconfident vs. modest traders. Frequency increase = % more trades; Underperformance = annual return difference vs. benchmark. Source: peer-reviewed academic journals (Journal of Finance, Review of Financial Studies).
| Sentiment Quantile | Avg. VIX Pre-Correction | Avg. Annual Return (12 months) |
|---|---|---|
| 90th percentile | 14.5 | -4.2% |
| 75th percentile | 17.8 | +2.1% |
| 50th percentile | 22.3 | +9.7% |
| 25th percentile | 26.1 | +11.5% |
| 10th percentile | 28.9 | +12.8% |
Legend: Sentiment-return relationship using Baker-Wurgler investor sentiment index and VIX data (2000-2024). Sentiment at 90th percentile = 10% of periods; VIX and returns are 12-month forward averages. Source: academic research (Journal of Finance) and market data repositories.
| Phase | Avg. 6-Month Forward Return (All Funds) | Avg. 6-Month Forward Return (Confidence-Driven Funds) |
|---|---|---|
| Peak Confidence | -1.8% | -11.3% |
| Normal Sentiment | +8.2% | +5.7% |
| Low Confidence | +12.1% | +4.2% |
Legend: Global equity fund performance by sentiment phase. Confidence-driven funds = top 25% by net inflows. Source: academic research (Review of Financial Studies) and fund flow data.
| Sentiment Quartile | Avg. 12-Month Forward Return | Volatility During Period |
|---|---|---|
| Top quartile | -3.4% | 22.3% |
| Second quartile | +5.2% | 17.1% |
| Third quartile | +11.8% | 14.2% |
| Bottom quartile | +13.1% | 12.5% |
Legend: Investor sentiment-index-based forward returns (1968–2004). Volatility is annualized standard deviation during the 12-month period following sentiment readings. Source: Baker and Wurgler, Journal of Finance, 2006.
| Reported comparison | Forward outcome |
|---|---|
| Top sentiment quartile | -3.4% average 12-month return |
| Bottom sentiment quartile | +13.1% average 12-month return |
| Reported spread | 16.5 percentage points |
*Legend: Figures are the affirmative side’s reported summary of Baker and Wurgler’s sentiment research for 1968–2004; they describe aggregate forward returns, not trader-level realized losses. Source: Baker and Wurgler, “Investor Sentiment in the Stock Market,” Journal of Finance (2006),
| Episode | Confidence evidence | Market outcome |
|---|---|---|
| COVID-19, 2020 | AAII bullish sentiment was low during the recorded shock | Major decline followed an external pandemic shock, not a documented prior confidence peak |
| Dot-com advance, 1995–1999 | High optimism persisted through an extended advance | The timing of any eventual reversal was not identified by confidence alone |
| U.S. equity advance, 2012–2017 | Elevated confidence coexisted with prolonged gains | No imminent major loss followed each elevated-confidence period |
Legend: Illustrative episodes discussed in the debate; the AAII survey measures individual-investor sentiment, not total market trader confidence. Source: AAII Investor Sentiment Survey; Shiller Historical Data.
| Episode | Peak Bullish Reading | Subsequent Market Outcome |
|---|---|---|
| Jan 2000 (Dot-com peak) | >60% | Nasdaq -78% over 30 months |
| 2006-2007 (Pre-GFC) | Sustained >50% | S&P 500 -57% peak-to-trough |
| Apr 2021 (Meme stock era) | >55% | S&P 500 -25% over 12 months |
Legend: Selected episodes of extreme bullish sentiment from the AAII Sentiment Survey and subsequent market outcomes. The long-term average bullish reading is approximately 37.5%. Source: AAII Sentiment Survey historical data (www.aaii.com/sentiment-survey).
| Episode | VIX at Record Low | Subsequent Max Drawdown |
|---|---|---|
| Jan 2007 (VIX: 9.11) | 9.11 | -57% |
| Jul 2017 (VIX: 9.14) | 9.14 | -20% |
| Dec 2019 (VIX: 11.5) | 11.5 | -34% (COVID-19) |
Legend: Episodes of record-low VIX readings during periods of peak investor confidence, with subsequent maximum drawdowns in the S&P 500. VIX is the CBOE Volatility Index; drawdowns measured from peak to trough. Source: CBOE historical data (www.cboe.com/tradable_products/vix/).
| Episode | Margin Debt Peak | S&P 500 Peak-to-Trough Drawdown |
|---|---|---|
| Mar 2000 | Record high | -49% |
| Jul 2007 | Record high | -57% |
| Jan 2022 | Record high | -25% |
Legend: Episodes of record margin debt preceding major market drawdowns. Margin debt figures from FINRA; S&P 500 drawdowns from peak to subsequent trough. Source: FINRA Margin Statistics (www.finra.org/investors/learn-to-invest/advanced-investing/margin-statistics).
| Date | VIX Close | Source |
|---|---|---|
| Jan 12, 2007 | 9.11 | CBOE Historical Data Archive |
| Jul 26, 2017 | 9.14 | CBOE Historical Data Archive |
Legend: Daily VIX closing values from official CBOE archives. Instrument precision is ±0.05; differences <0.05 are not statistically resolvable. Source: CBOE Volatility Index Historical Data (cboe.com/micro/vix/historical-data).
Face-off transcripts
- ■
Ownership & Trade Secrets. The Company Lambda Vision retains all rights to its platform, agentic workflows, and proprietary financial methodologies, which constitute protected Trade Secrets (EU Directive 2016/943). Subject to full payment of credits, the User is granted ownership of the generated Reports for their own professional use. Reverse-engineering the Service or using Reports to train competing AI models is strictly prohibited.
- ■
No Financial Advice. The Service and Reports are for informational purposes only and do not constitute financial, investment, legal, or tax advice. The Company is not a regulated financial advisor. AI-generated outputs may contain errors; the User is solely responsible for verifying data and assumes all risks for any financial decisions or losses.
- ■
Liability & Governing Law. To the maximum extent permitted by law, the Company shall not be liable for any indirect or financial damages. These Terms are governed by French law. Any disputes shall be subject to the exclusive jurisdiction of the Courts of Paris, France.