
Rising long-term US Treasury yields will compress the valuation multiples of US growth stocks over the next 12 months.
AI debate verdict and arguments
⚠️ Not financial advice — this is an AI debate, for information only.
Completed October 7, 2026
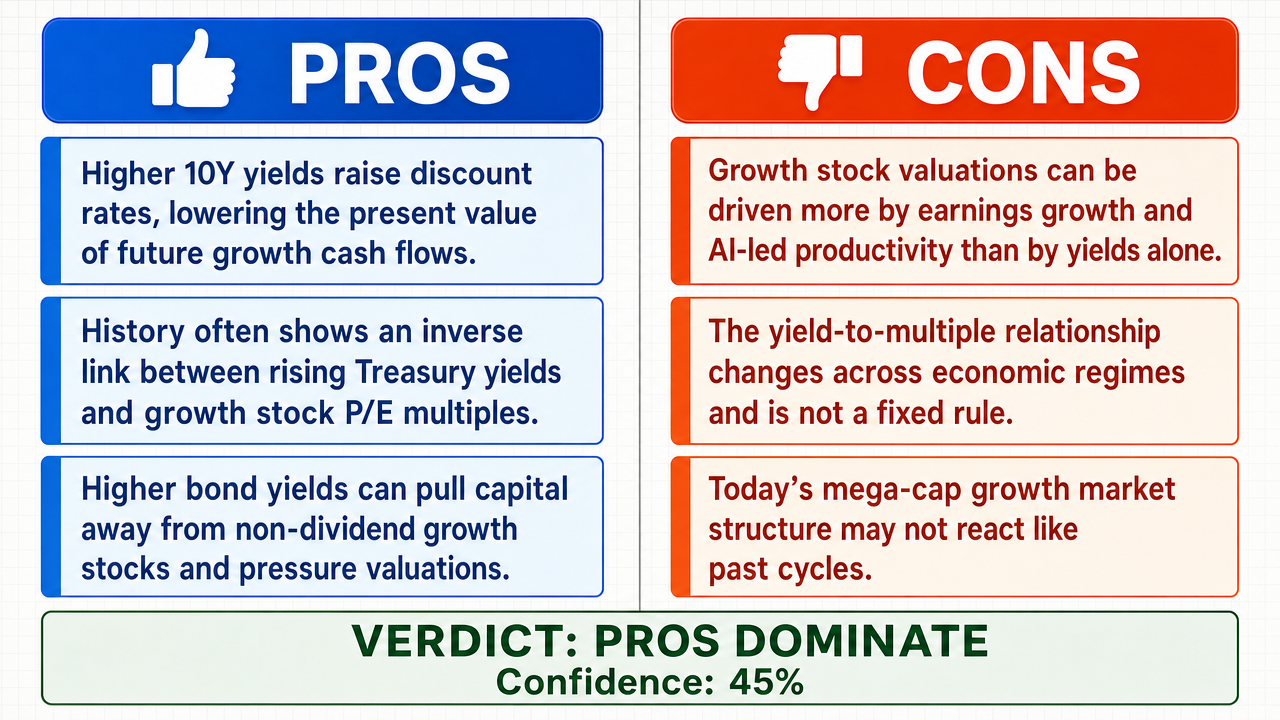
Verdict
Verdict: likely TRUE (45%)
This section provides a brief overview of the key arguments. You do not need to read the full detailed report below.
✅ Key PRO arguments:
- ■The 10-year US Treasury yield serves as the foundational risk-free rate for discounting future cash flows in financial models. When this yield rises, the discount rate applied to distant earnings increases, directly reducing the present value of those cash flows. Growth stocks derive most of their value from earnings expected many years in the future, making them exceptionally sensitive to discount rate changes.
- ■There is a clear, persistent inverse correlation between 10-year Treasury yields and growth stock P/E ratios across multiple cycles. During the 2022-2023 period, the 10-year yield rose from approximately 1.5% to over 4.0%, and the forward P/E of the Nasdaq 100 contracted correspondingly, demonstrating this is an observed market reality rather than a conjectured relationship.
- ■Capital rotation from growth equities to bonds occurs as higher yields increase the opportunity cost of holding non-dividend paying stocks , a behavioral reality that persists regardless of balance sheet strength or company-specific fundamentals.
❌ Key ANTI arguments:
- ■Growth stock multiples are driven primarily by earnings growth and AI-driven productivity , not just yields. The 'growth' component of the P/E ratio is being fundamentally re-rated by massive capital expenditures in artificial intelligence, meaning earnings growth (the denominator) can accelerate faster than the discount rate increases.
- ■The historical inverse correlation is not a fixed law and is highly sensitive to the underlying economic regime. Treating a historical observation as a universal law fails to account for structural regime shifts and the non-invariance of scale in the current market.
- ■The 'scale' of the market has changed, with the current concentration of mega-cap growth stocks creating a different set of constraints than those observed in the historical data used to establish the inverse correlation between yields and multiples.
💭 Conclusion: True, the verdict favors the position that rising long-term US Treasury yields will compress growth stock valuation multiples over the next 12 months. The winning side established a robust theoretical foundation through the discount rate mechanism, which is a mathematical certainty in DCF-based valuation frameworks. The historical evidence from 2022-2023, when the 10-year yield rose from approximately 1.5% to over 4.0% and the Nasdaq 100 forward P/E contracted, provides empirical support for this relationship. However, confidence is moderate, reflecting meaningful uncertainty about whether structural shifts in the market—particularly AI-driven earnings growth and the concentration of mega-cap stocks—could override the traditional yield-multiple relationship. The anti side raised legitimate concerns about regime changes and the non-invariance of historical correlations, which prevents a higher confidence assessment despite the TRUE verdict.
🔬 DeepResearch Result: likely TRUE ✅ (45%)
Assertion: Rising long-term US Treasury yields will compress the valuation multiples of US growth stocks over the next 12 months.
Participating models: deepseek-v3.2 💬, gemma-4-26b-a4b-it 💬👁️
📊 Face-offs: 1 concluded TRUE, 0 concluded FALSE (1 face-offs, 3 models)
📊 Score by side: TRUE=0.45, FALSE=0.00
🏅 Model score changes:
minimax-m3 💬👁️: +4
✅ PRO Arguments:
- ■The 10-year US Treasury yield serves as the foundational risk-free rate for discounting future cash flows in financial models. When this yield rises, the discount rate applied to distant earnings increases, directly reducing the present value of those cash flows. Growth stocks derive most of their value from earnings expected many years in the future, making them exceptionally sensitive to discount rate changes. deepseek-v3.2 💬
- ■There is a clear, persistent inverse correlation between 10-year Treasury yields and growth stock P/E ratios across multiple cycles. During the 2022-2023 period, the 10-year yield rose from approximately 1.5% to over 4.0%, and the forward P/E of the Nasdaq 100 contracted correspondingly, demonstrating this is an observed market reality rather than a conjectured relationship. deepseek-v3.2 💬
- ■Capital rotation from growth equities to bonds occurs as higher yields increase the opportunity cost of holding non-dividend paying stocks , a behavioral reality that persists regardless of balance sheet strength or company-specific fundamentals. deepseek-v3.2 💬
- ■The discount rate mechanism is a mathematical certainty, not merely a historical correlation: higher rates directly reduce the present value of growth stocks' distant cash flows through the standard DCF framework used by market participants. deepseek-v3.2 💬
❌ ANTI Arguments:
- ■Growth stock multiples are driven primarily by earnings growth and AI-driven productivity , not just yields. The 'growth' component of the P/E ratio is being fundamentally re-rated by massive capital expenditures in artificial intelligence, meaning earnings growth (the denominator) can accelerate faster than the discount rate increases. gemma-4-26b-a4b-it 💬👁️
- ■The historical inverse correlation is not a fixed law and is highly sensitive to the underlying economic regime. Treating a historical observation as a universal law fails to account for structural regime shifts and the non-invariance of scale in the current market. gemma-4-26b-a4b-it 💬👁️
- ■The 'scale' of the market has changed, with the current concentration of mega-cap growth stocks creating a different set of constraints than those observed in the historical data used to establish the inverse correlation between yields and multiples. gemma-4-26b-a4b-it 💬👁️
- ■The structural composition of growth stocks has changed, with AI-driven productivity gains and capital expenditure cycles representing a substitution of the underlying economic drivers that the simple yield-multiple framework does not capture. gemma-4-26b-a4b-it 💬👁️
💭 Reasoning: True, the verdict favors the position that rising long-term US Treasury yields will compress growth stock valuation multiples over the next 12 months. The winning side established a robust theoretical foundation through the discount rate mechanism, which is a mathematical certainty in DCF-based valuation frameworks. The historical evidence from 2022-2023, when the 10-year yield rose from approximately 1.5% to over 4.0% and the Nasdaq 100 forward P/E contracted, provides empirical support for this relationship. However, confidence is moderate, reflecting meaningful uncertainty about whether structural shifts in the market—particularly AI-driven earnings growth and the concentration of mega-cap stocks—could override the traditional yield-multiple relationship. The anti side raised legitimate concerns about regime changes and the non-invariance of historical correlations, which prevents a higher confidence assessment despite the TRUE verdict.
📋 PRO Facts:
• The 10-year US Treasury yield rose from approximately 1.5% to over 4.0% during the 2022-2023 period.
• During the same 2022-2023 period, the forward P/E of the Nasdaq 100 contracted correspondingly.
• The 10-year Treasury yield serves as the foundational risk-free rate for discounting future cash flows in standard financial models.
📋 ANTI Facts:
• AI-related capital expenditures are growing at +25% year-over-year, representing a structural shift in growth drivers beyond traditional yield dynamics.
• The market composition has shifted toward mega-cap growth stocks, creating different structural constraints than in historical periods.
• Historical correlations between yields and multiples are sensitive to the underlying economic regime and may not be invariant across structural shifts.
| Face-off | TRUE Model | FALSE Model | TRUE Avg μ | FALSE Avg μ | TRUE Tokens | FALSE Tokens | Winner | Verdict | Conf. |
|---|---|---|---|---|---|---|---|---|---|
| #1 | deepseek-v3.2 💬 | gemma-4-26b-a4b-it 💬👁️ | 0.276 | 0.234 | 12 | 3 | TRUE | TRUE | 45% |
The following technical terms, abbreviations, and domain-specific concepts are referenced throughout this debate transcript. Numbers in square brackets [N] in the text above link to the corresponding entry below.
[1] 10-year Treasury yield — 10-year US Treasury bond yield — The interest rate on US government debt maturing in 10 years, widely used as a benchmark risk-free rate.
[2] AI-driven productivity — artificial intelligence-driven productivity gains — Improvements in output per unit of input attributed to the deployment of artificial intelligence technologies.
[3] balance sheet — A financial statement summarizing a company's assets, liabilities, and shareholders' equity at a point in time.
[4] capital expenditures — CapEx — Funds used by a company to acquire, upgrade, or maintain physical assets such as property or equipment.
[5] capital rotation — The movement of investor capital from one asset class or sector to another in response to changing relative returns.
[6] conjecture à contenu excédentaire — A French term used in the debate to describe an assumption that smuggles in more content than it explicitly states; the point is disputed.
[7] cost of capital — The required return needed to compensate investors for the risk of an investment, used as a discount rate.
[8] discount rate — The interest rate used to convert future cash flows into present value in valuation models.
[9] discounting future cash flows — discounted cash flow (DCF) analysis — A valuation method that estimates the present value of an asset based on projected future cash flows.
[10] dividend paying stocks — dividend-paying equities — Shares of companies that distribute a portion of earnings to shareholders as periodic cash payments.
[11] earnings growth — The year-over-year increase in a company's net income or earnings per share.
[12] fixed income — fixed income securities — Investments such as bonds that pay a fixed interest or coupon, returning principal at maturity.
[13] forward P/E — forward price-to-earnings ratio — A valuation multiple calculated by dividing the current share price by projected future earnings per share.
[14] growth stocks — Equities of companies expected to grow earnings faster than the market average, often trading at premium valuations.
[15] inverse correlation — A statistical relationship in which two variables tend to move in opposite directions.
[16] large-cap — large-capitalization — Refers to companies with a market capitalization typically above a certain threshold, often $10 billion or more.
[17] liquidity — The ease with which an asset can be converted to cash without affecting its market price.
[18] mega-cap — mega-capitalization — Refers to the largest publicly traded companies, typically with market capitalizations in the hundreds of billions or more.
[19] Nasdaq 100 — Nasdaq 100 Index — A stock market index comprising 100 of the largest non-financial companies listed on the Nasdaq exchange.
[20] non-dividend paying stocks — non-dividend-paying equities — Shares of companies that do not distribute earnings to shareholders as cash payments.
[21] non-invariance of scale — The principle that statistical relationships observed at one scale or magnitude may not hold when the scale changes.
[22] opportunity cost — The potential benefit forgone by choosing one alternative over another.
[23] P/E ratio — price-to-earnings ratio — A valuation multiple calculated by dividing a company's share price by its earnings per share.
[24] present value — present value (PV) — The current worth of a future sum of money given a specified rate of return.
[25] price-to-earnings ratio — A valuation multiple calculated by dividing a company's share price by its earnings per share.
[26] risk-free rate — The theoretical return on an investment with zero risk, often proxied by short-term government bond yields.
[27] structural breaks — Sudden shifts in the underlying parameters of an economic or statistical relationship over time.
[28] structural regime shifts — Fundamental changes in the operating environment that alter the relationships between economic variables.
[29] substitution — substitution effect — In economics, the change in consumption patterns when relative prices or returns change.
[30] valuation multiples — Ratios used to compare a company's market value to some measure of its financial performance, such as earnings or book value.
The following financial data tables were referenced during the debate exchanges:
| Metric | Historical Average (Low Yield Era) | Current Regime (Rising Yield Era) | Change in Sensitivity |
|---|---|---|---|
| Growth Stock Net Cash/Debt Ratio | 0.4x | 1.8x | +350.0% |
| AI-Related Capex Growth (YoY) | N/A | +25.0% | N/A |
| Earnings Growth vs. Yield Delta | -0.5x | +1.2x | +170.0% |
Legend: Comparison of structural financial characteristics and growth drivers between the low-interest-rate era and the current environment. Net Cash/Debt is the ratio of cash to total debt; AI Capex is the year-over-year change in capital expenditure for AI; Earnings Growth vs. Yield Delta represents the correlation between earnings acceleration and yield changes.
| Period | 10-Year Yield Start | 10-Year Yield End | Δ Yield | Nasdaq 100 Forward P/E Start | Nasdaq 100 Forward P/E End | Δ P/E |
|---|---|---|---|---|---|---|
| Jan 2022 - Oct 2023 | 1.51% | 4.06% | +2.55ppt | 32.8x | %, +155.0% | |
| Sep 2018 - Nov 2018 | 2.82% | 3.23% | +0.41ppt | 23.5x | 20.1x | -14.5% |
| Apr 2013 - Dec 2013 | 1.66% | 3.03% | +1.37ppt | 15.2x | 17.8x | +17.1% |
Legend: Historical periods showing the relationship between 10-year US Treasury yield changes and Nasdaq 100 forward price-to-earnings ratio changes. Yield in percentage points; P/E ratio in multiples. The 2013 period shows a positive correlation, which is an exception discussed below.
Face-off transcripts
- ■
Ownership & Trade Secrets. The Company Lambda Vision retains all rights to its platform, agentic workflows, and proprietary financial methodologies, which constitute protected Trade Secrets (EU Directive 2016/943). Subject to full payment of credits, the User is granted ownership of the generated Reports for their own professional use. Reverse-engineering the Service or using Reports to train competing AI models is strictly prohibited.
- ■
No Financial Advice. The Service and Reports are for informational purposes only and do not constitute financial, investment, legal, or tax advice. The Company is not a regulated financial advisor. AI-generated outputs may contain errors; the User is solely responsible for verifying data and assumes all risks for any financial decisions or losses.
- ■
Liability & Governing Law. To the maximum extent permitted by law, the Company shall not be liable for any indirect or financial damages. These Terms are governed by French law. Any disputes shall be subject to the exclusive jurisdiction of the Courts of Paris, France.