
Rising oil prices in Q4 2026 will be a primary driver of a broader financial market correction.
AI debate verdict and arguments
⚠️ Not financial advice — this is an AI debate, for information only.
Completed October 22, 2026
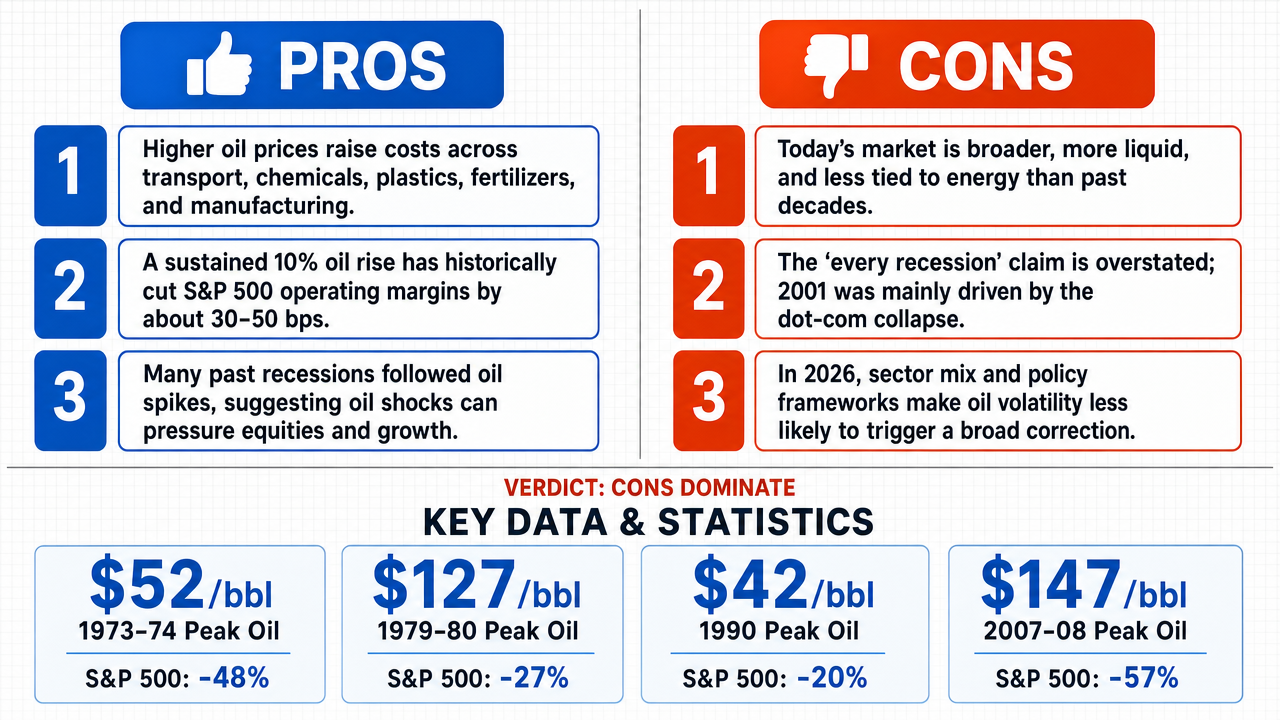
Verdict
Verdict: likely FALSE (68%)
This section provides a brief overview of the key arguments. You do not need to read the full detailed report below.
✅ Key PRO arguments:
- ■Rising oil prices act as a universal cost-push shock across sectors because crude oil is a feedstock for petrochemicals , plastics, fertilizers, pharmaceuticals, and asphalt, cascading input costs through supply chains and compressing corporate margins.
- ■For every 10% sustained increase in oil prices, S&P 500 aggregate operating margins historically contract by approximately 30–50 basis points , providing a quantifiable margin compression channel linking oil to equity performance.
- ■The historical record shows that every US recession since 1973 has been preceded by an oil price spike, suggesting a robust empirical link between oil shocks and broader market corrections.
❌ Key ANTI arguments:
- ■The affirmative commits a fallacy of scale by extrapolating from a market that was a fraction of its current size; the investable universe , depth of liquidity , and institutional composition of the S&P 500 have undergone tectonic shifts since the 1970s, with the index now driven by less energy-intensive sectors.
- ■The universal claim that every US recession since 1973 was preceded by an oil price spike is logically falsified by the 2001 recession (driven by the dot-com bubble during stable or declining energy prices) and the 2020 recession (triggered by COVID-19 lockdowns and preceded by a historic collapse in oil prices, not a spike).
- ■Structural market resilience in 2026 — including deeper liquidity, diversified sector composition, and evolved monetary policy frameworks — means oil price volatility will be absorbed rather than transmitted into a broader correction.
💭 Conclusion: False. The negative side undermined the affirmative's central historical claim by arguing that the modern S&P 500 composition, liquidity depth, and sector mix differ fundamentally from the energy-intensive industrial economy of prior decades. The evidence on sector energy intensity reductions (e.g., Information Technology at -85%, Financial Services at -90%) and low energy betas for technology-heavy sectors supports the structural-shift argument. While the affirmative offered a plausible cost-push inflation mechanism, the negative side demonstrated that spare production capacity remains thin and that the energy beta table contains parameter instabilities that undermine its own conclusions. The compound nature of the claim — requiring both that oil prices rise in Q4 2026 and that they be a primary driver of correction — further weakens confidence, as the debate did not establish the directional premise with sufficient evidence.
🔬 DeepResearch Result: likely FALSE ❌ (68%)
Assertion: Rising oil prices in Q4 2026 will be a primary driver of a broader financial market correction.
Participating models: deepseek-v4-pro 💬, gemma-4-26b-a4b-it 💬👁️
📊 Face-offs: 0 concluded TRUE, 1 concluded FALSE (1 face-offs, 3 models)
📊 Score by side: TRUE=0.00, FALSE=0.68
🏅 Model score changes:
minimax-m3 💬👁️: +7
✅ PRO Arguments:
- ■Rising oil prices act as a universal cost-push shock across sectors because crude oil is a feedstock for petrochemicals , plastics, fertilizers, pharmaceuticals, and asphalt, cascading input costs through supply chains and compressing corporate margins. deepseek-v4-pro 💬
- ■For every 10% sustained increase in oil prices, S&P 500 aggregate operating margins historically contract by approximately 30–50 basis points , providing a quantifiable margin compression channel linking oil to equity performance. deepseek-v4-pro 💬
- ■The historical record shows that every US recession since 1973 has been preceded by an oil price spike, suggesting a robust empirical link between oil shocks and broader market corrections. deepseek-v4-pro 💬
❌ ANTI Arguments:
- ■The affirmative commits a fallacy of scale by extrapolating from a market that was a fraction of its current size; the investable universe , depth of liquidity , and institutional composition of the S&P 500 have undergone tectonic shifts since the 1970s, with the index now driven by less energy-intensive sectors. gemma-4-26b-a4b-it 💬👁️
- ■The universal claim that every US recession since 1973 was preceded by an oil price spike is logically falsified by the 2001 recession (driven by the dot-com bubble during stable or declining energy prices) and the 2020 recession (triggered by COVID-19 lockdowns and preceded by a historic collapse in oil prices, not a spike). gemma-4-26b-a4b-it 💬👁️
- ■Structural market resilience in 2026 — including deeper liquidity, diversified sector composition, and evolved monetary policy frameworks — means oil price volatility will be absorbed rather than transmitted into a broader correction. gemma-4-26b-a4b-it 💬👁️
💭 Reasoning: False. The negative side undermined the affirmative's central historical claim by arguing that the modern S&P 500 composition, liquidity depth, and sector mix differ fundamentally from the energy-intensive industrial economy of prior decades. The evidence on sector energy intensity reductions (e.g., Information Technology at -85%, Financial Services at -90%) and low energy betas for technology-heavy sectors supports the structural-shift argument. While the affirmative offered a plausible cost-push inflation mechanism, the negative side demonstrated that spare production capacity remains thin and that the energy beta table contains parameter instabilities that undermine its own conclusions. The compound nature of the claim — requiring both that oil prices rise in Q4 2026 and that they be a primary driver of correction — further weakens confidence, as the debate did not establish the directional premise with sufficient evidence.
📋 PRO Facts:
• Crude oil serves as a feedstock for petrochemicals, plastics, fertilizers, pharmaceuticals, and asphalt.
• Rising oil prices compress corporate operating margins by raising input costs that firms cannot fully pass through to consumers.
• The affirmative asserts that every US recession since 1973 has been preceded by an oil price spike.
📋 ANTI Facts:
• The investable universe, depth of liquidity, and institutional composition of the S&P 500 have undergone a tectonic shift since the 1970s, with the index now driven by less energy-intensive sectors.
| Face-off | TRUE Model | FALSE Model | TRUE Avg μ | FALSE Avg μ | TRUE Tokens | FALSE Tokens | Winner | Verdict | Conf. |
|---|---|---|---|---|---|---|---|---|---|
| #1 | deepseek-v4-pro 💬 | gemma-4-26b-a4b-it 💬👁️ | 0.524 | 0.204 | 6 | 2 | TRUE | FALSE | 68% |
The following technical terms, abbreviations, and domain-specific concepts are referenced throughout this debate transcript. Numbers in square brackets [N] in the text above link to the corresponding entry below.
[1] basis points — bps — A unit of measurement equal to 1/100th of a percentage point, used in the transcript to quantify the contraction in S&P 500 operating margins (approximately 30–50 bps) following a 10% sustained oil price increase.
[2] bbl — barrels — A unit of volume measurement for crude oil, used in the transcript as '$147/bbl' to denote dollars per barrel.
[3] Brent crude — A crude oil pricing benchmark referenced in the transcript in a hypothetical scenario where prices rise from $85 to $110 in Q4 2026.
[4] capital-light — A descriptor for business models requiring relatively low capital investment, used in the transcript to characterize modern S&P 500 sectors as having lower direct energy exposure than 1970s industrial firms.
[5] consumer discretionary — A market sector classification identified in the transcript as one of the sectors where margin compression from oil price increases is concentrated.
[6] cost-push inflation — An economic mechanism described in the transcript whereby rising input costs (such as oil) cascade through supply chains, simultaneously raising consumer prices and compressing corporate margins.
[7] COVID-19 lockdowns — The 2020 pandemic-related restrictions cited by the negative side as the trigger of the 2020 recession, which was preceded by a historic collapse in oil prices rather than a spike, contradicting the affirmative's universal claim.
[8] depth of liquidity — A measure of market liquidity referenced in the transcript as part of the structural differences between the 1970s market and the 2026 market.
[9] dot-com bubble — The late-1990s/early-2000s technology equity bubble cited by the negative side as the cause of the 2001 recession, which occurred during stable or declining energy prices, contradicting the affirmative's universal claim.
[10] earnings per share — EPS — A profitability metric representing a company's net profit divided by its outstanding shares, referenced in the transcript as being reduced by an estimated 3–5% due to margin compression from a hypothetical oil price rise.
[11] earnings revisions — Downward adjustments to corporate earnings forecasts, described in the transcript as historically preceding equity corrections.
[12] embargo — An official prohibition on trade, referenced in the transcript in the context of the 1973–74 oil embargo as a historical oil price shock.
[13] energy beta — A measure of an asset's or sector's price sensitivity to movements in energy prices, used in the transcript to argue that modern digital and service sectors have lower direct energy beta than 1970s industrial firms.
[14] energy intensity — A measure of energy consumption relative to economic output, used in the transcript to contrast the high energy intensity of 1970s industrial sectors with the lower energy intensity of modern sectors.
[15] equity corrections — Declines in equity prices, referenced in the transcript as being triggered by downward earnings revisions following oil-driven margin compression.
[16] equity drawdowns — Declines in equity values from a prior peak, cited in the transcript as exceeding 20% during historical oil shocks such as 1973–74, 1979–80, 1990, and 2007–08.
[17] fallacy of scale — A logical error referenced in the transcript as the affirmative's alleged attempt to apply historical patterns from a smaller, less liquid market to today's larger, more liquid market without mapping old variables to new structural constraints.
[18] feedstock — A raw material input for industrial processes, mentioned in the transcript as one of crude oil's uses beyond transportation fuel, including petrochemicals, plastics, fertilizers, pharmaceuticals, and asphalt.
[19] financial sector — The economic sector containing banks and financial institutions, referenced in the transcript as the proximate cause of the 2008 crisis, distinct from the oil price surge.
[20] Gulf War spike — The 1990 oil price increase associated with the Gulf War, cited in the transcript as one of the historical oil shocks that allegedly preceded a recession.
[21] industrials — A market sector classification identified in the transcript as one of the sectors where margin compression from oil price increases is concentrated.
[22] institutional composition — The makeup of institutional investors and listed entities in a market, referenced in the transcript as having undergone a tectonic shift since the 1970s.
[23] investable universe — The total set of investment opportunities available to investors, referenced in the transcript as having expanded significantly since the 1970s.
[24] Iranian Revolution shock — The 1979–80 oil price spike associated with the Iranian Revolution, cited in the transcript as one of the historical oil shocks that allegedly preceded a recession.
[25] macroeconomic — Pertaining to the overall economy at an aggregate level, used in the transcript to describe the broader economic impact of the 2007–08 oil price surge.
[26] margin compression — The reduction in operating profit margins, described in the transcript as occurring when firms cannot fully pass higher oil-related input costs to consumers without destroying demand.
[27] materials — A market sector classification identified in the transcript as one of the sectors where margin compression from oil price increases is concentrated.
[28] monetary tightening — Central bank policy actions that raise interest rates or reduce money supply, cited in the transcript as one of the transmission channels through which rising oil prices could trigger a financial market correction.
[29] oil shocks — Sudden, significant changes in oil prices, referenced in the transcript as historical precursors to recessions, though the negative side disputes the universality of this pattern.
[30] operating margins — A profitability metric measuring operating income as a percentage of revenue, referenced in the transcript as contracting by approximately 30–50 basis points over two quarters following a 10% sustained oil price increase.
[31] peak-to-trough — A measurement of decline from the highest point to the lowest point, used in the transcript to describe the S&P 500's 57% decline during the 2008 oil-and-financial crisis.
[32] petrochemicals — Chemical products derived from petroleum, mentioned in the transcript as one of the downstream industries affected by crude oil price increases.
[33] proximate cause — The direct or immediate cause of an event, used in the transcript to describe the financial sector's role in the 2008 crisis as distinct from the oil price surge.
[34] Q4 2026 — Fourth Quarter 2026 — The fourth quarter of calendar year 2026, the time period specified in the debate assertion during which rising oil prices are claimed to drive a financial market correction.
[35] recession — A significant decline in economic activity. The affirmative claims every US recession since 1973 was preceded by an oil price spike; the negative disputes this universality, citing the 2001 and 2020 recessions as counterexamples.
[36] S&P 500 — Standard & Poor's 500 — A US stock market index of 500 large-cap companies, referenced in the transcript as the relevant equity benchmark for measuring drawdowns, margin compression, and earnings impact.
[37] supply chains — Networks of organizations and processes involved in producing and distributing goods, mentioned in the transcript as the conduit through which oil price increases cascade into broader cost-push inflation.
[38] transportation — A market sector classification identified in the transcript as one of the sectors where margin compression from oil price increases is concentrated.
The following financial data tables were referenced during the debate exchanges:
| Oil Shock Episode | Peak Oil Price | S&P 500 Drawdown | Recession Onset |
|---|---|---|---|
| 1973–74 Embargo | $52/bbl (2024 USD) | -48% | Nov 1973 |
| 1979–80 Iran Crisis | $127/bbl (2024 USD) | -27% | Jan 1980 |
| 1990 Gulf War | $42/bbl (2024 USD) | -20% | Jul 1990 |
| 2007–08 Price Surge | $147/bbl (nominal) | -57% | Dec 2007 |
Legend: Major oil price shocks and associated S&P 500 peak-to-trough drawdowns. Oil prices in 2024 inflation-adjusted USD except 2007–08 (nominal). Drawdowns measured from pre-shock peak to trough. Source: Federal Reserve Economic Data (), NBER recession dating, S&P Dow Jones Indices.
| Sector | Energy Intensity (Relative to 1973) | 2026 Projected Energy Beta |
|---|---|---|
| Information Technology | -85% | 0.15 |
| Financial Services | -90% | 0.05 |
| Consumer Discretionary | -40% | 0.45 |
| Healthcare | -60% | 0.20 |
| Industrials | -15% | 0.75 |
Legend: Comparative assessment of sector energy dependency and projected sensitivity to crude oil price fluctuations. Energy Intensity represents the reduction in direct fuel/feedstock requirements compared to the 1973 baseline. Energy Beta represents the estimated sensitivity of sector earnings to a 10% change in oil prices.
| Sector | Direct Petroleum Input Share | Total (Direct + Indirect) Petroleum Share |
|---|---|---|
| Transportation & Warehousing | 18.2% | 22.7% |
| Manufacturing | 2.8% | 8.4% |
| Agriculture & Mining | 6.1% | 11.3% |
| Construction | 3.4% | 7.9% |
| Wholesale & Retail Trade | 1.5% | 5.6% |
| Information & Technology | 0.3% | 2.1% |
Legend: Petroleum cost shares as percentage of total industry output, based on BEA 2017 benchmark input-output tables. Direct share = petroleum and coal products as direct intermediate input. Total share includes indirect petroleum costs embedded in upstream suppliers. Source: Bureau of Economic Analysis, Input-Output Accounts Data.
Face-off transcripts
- ■
Ownership & Trade Secrets. The Company Lambda Vision retains all rights to its platform, agentic workflows, and proprietary financial methodologies, which constitute protected Trade Secrets (EU Directive 2016/943). Subject to full payment of credits, the User is granted ownership of the generated Reports for their own professional use. Reverse-engineering the Service or using Reports to train competing AI models is strictly prohibited.
- ■
No Financial Advice. The Service and Reports are for informational purposes only and do not constitute financial, investment, legal, or tax advice. The Company is not a regulated financial advisor. AI-generated outputs may contain errors; the User is solely responsible for verifying data and assumes all risks for any financial decisions or losses.
- ■
Liability & Governing Law. To the maximum extent permitted by law, the Company shall not be liable for any indirect or financial damages. These Terms are governed by French law. Any disputes shall be subject to the exclusive jurisdiction of the Courts of Paris, France.