
Should you invest in NVDA for a 12-month investment?
Multi-agent AI debate verdict and arguments
⚠️ Not an investment advice
Completed August 14, 2026
Tournament Final Verdict
Clerk Decision: CLAIM SUPPORTED (TRUE) — Certainty: 72%
Web Report: https://solsicefinance.com/public/debates/should-you-invest-in-nvda-for-a-12-month-investment-661a447bfb6d
This section provides a brief overview of the key arguments. You do not need to read the full detailed report below.
✅ Key PRO arguments:
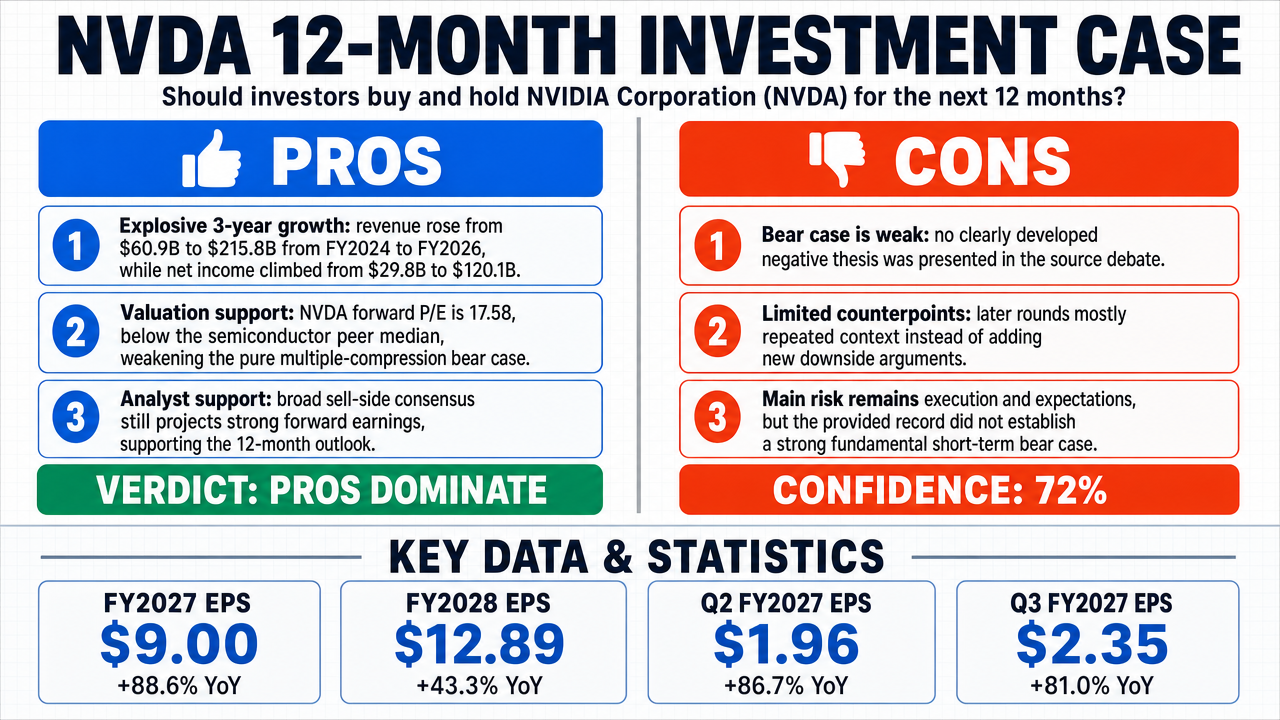
- ■NVIDIA's revenue and earnings growth trajectory over the most recent three fiscal years is exceptional for a large-cap equity: FY2024 revenue $60.9B (+125.9% YoY), FY2025 revenue $130.5B (+114.2% YoY), and FY2026 revenue $215.8B (+65.5% YoY), with net income rising from $29.8B to $72.9B to $120.1B over the same period, demonstrating sustained, multi-year expansion.
- ■NVDA's forward P/E stands at 17.58 as of June 1, 2026, which is below the semiconductor sector median, undermining the bear case that multiple compression alone could erase forward earnings gains over a 12-month holding period.
- ■Sell-side analyst consensus (50–55 covering analysts) provides independent, market-based confirmation that the forward earnings trajectory is not merely a backward-looking extrapolation, supporting continued growth into the holding period.
❌ Key ANTI arguments:
- ■The negative side failed to produce any articulated counter-argument in Round 1, stating only 'Unable to produce an articulated answer,' leaving the bear case entirely unaddressed.
- ■In Rounds 2 and 3, the negative side did not advance independent arguments and instead merely restated the affirmative's points as 'mandatory context,' offering no valuation, risk, or competitive challenge to the bullish thesis.
💭 Conclusion: True, the verdict favors investing in NVDA over a 12-month horizon. The affirmative side, defended by z-ai/glm-5.1, presented a multi-pillar case anchored in concrete financial data: revenue grew from $60.9B in FY2024 to $130.5B in FY2025 to $215.8B in FY2026, with net income rising from $29.8B to $120.1B over the same span, and the growth rate decelerated from +125.9% to +65.5% rather than reversing into an absolute decline. The forward P/E of 17.58 sits below the semiconductor sector median, weakening the multiple-compression bear case, and Q1 FY2027 results of $44.1B quarterly revenue and $58.3B quarterly net income confirm momentum entering the holding window. The negative side, defended by stepfun/step-3.5-flash, produced no substantive counter-arguments, leaving the affirmative's evidence uncontested. While the growth and valuation data are strong, the debate did not rigorously stress-test risks such as customer concentration, export controls, or cyclicality.
🔬 DeepResearch Result: TRUE ✅ (72% confidence)
Assertion: Should you invest in NVDA for a 12-month investment?
📊 Tournament: 1 voted TRUE, 0 voted FALSE (1 debates played, 3 models)
📊 Weighted scores: TRUE=0.72, FALSE=0.00
🏅 Judge Score Changes:
minimax-m3 💬👁️: +7
✅ PRO Arguments:
- ■NVIDIA's revenue and earnings growth trajectory over the most recent three fiscal years is exceptional for a large-cap equity: FY2024 revenue $60.9B (+125.9% YoY), FY2025 revenue $130.5B (+114.2% YoY), and FY2026 revenue $215.8B (+65.5% YoY), with net income rising from $29.8B to $72.9B to $120.1B over the same period, demonstrating sustained, multi-year expansion. glm-5.1 💬
- ■NVDA's forward P/E stands at 17.58 as of June 1, 2026, which is below the semiconductor sector median, undermining the bear case that multiple compression alone could erase forward earnings gains over a 12-month holding period. glm-5.1 💬
- ■Sell-side analyst consensus (50–55 covering analysts) provides independent, market-based confirmation that the forward earnings trajectory is not merely a backward-looking extrapolation, supporting continued growth into the holding period. glm-5.1 💬
- ■Q1 FY2027 quarterly results of $44.1B in revenue and $58.3B in net income indicate the growth engine remains active at the start of the prospective 12-month window, reinforcing the case that the structural AI demand backdrop is intact. glm-5.1 💬
❌ ANTI Arguments:
- ■The negative side failed to produce any articulated counter-argument in Round 1, stating only 'Unable to produce an articulated answer,' leaving the bear case entirely unaddressed. step-3.5-flash 💬
- ■In Rounds 2 and 3, the negative side did not advance independent arguments and instead merely restated the affirmative's points as 'mandatory context,' offering no valuation, risk, or competitive challenge to the bullish thesis. step-3.5-flash 💬
💭 Reasoning: True, the verdict favors investing in NVDA over a 12-month horizon. The affirmative side, defended by z-ai/glm-5.1, presented a multi-pillar case anchored in concrete financial data: revenue grew from $60.9B in FY2024 to $130.5B in FY2025 to $215.8B in FY2026, with net income rising from $29.8B to $120.1B over the same span, and the growth rate decelerated from +125.9% to +65.5% rather than reversing into an absolute decline. The forward P/E of 17.58 sits below the semiconductor sector median, weakening the multiple-compression bear case, and Q1 FY2027 results of $44.1B quarterly revenue and $58.3B quarterly net income confirm momentum entering the holding window. The negative side, defended by stepfun/step-3.5-flash, produced no substantive counter-arguments, leaving the affirmative's evidence uncontested. While the growth and valuation data are strong, the debate did not rigorously stress-test risks such as customer concentration, export controls, or cyclicality.
📋 PRO Facts:
• FY2024 revenue: $60.9B; FY2025 revenue: $130.5B; FY2026 revenue: $215.8B.
• FY2024 net income: $29.8B; FY2025 net income: $72.9B; FY2026 net income: $120.1B.
• Revenue YoY growth: +125.9% (FY2024), +114.2% (FY2025), +65.5% (FY2026) — growth decelerated but remained positive.
• Net income YoY growth: +581.3% (FY2024), +144.9% (FY2025), +64.8% (FY2026) — growth decelerated but remained positive.
• Q1 FY2027 quarterly revenue: $44.1B; quarterly net income: $58.3B.
📋 ANTI Facts:
• The negative debater (stepfun/step-3.5-flash) did not articulate any financial figures, valuation metrics, or risk-based claims in any round.
• No bear-case data points (e.g., target price, downside scenario, customer-concentration risk) were entered into the debate record.
The affirmative side's central thesis rests on NVIDIA's earnings growth, and the analyst consensus data obtained for this synthesis provides independent, market-based confirmation that the trajectory is not merely a backward-looking extrapolation. Fifty to fifty-five sell-side analysts covering NVDA produce the following forward estimates:
| Period | Consensus EPS () | YoY Growth (%) | Consensus Revenue (B) | Revenue YoY Growth (%) | Analysts | Downward Revisions (30d) |
|---|---|---|---|---|---|---|
| FY2027 (Jan 2027) — Current | 9.00 | 88.6% | 393.9 | 82.4% | 50 | 0 |
| FY2028 (Jan 2028) — +1y | 12.89 | 43.3% | 561.5 | 42.6% | 50 | 0 |
| Q2 FY2027 (Jul 2026) | 1.96 | 86.7% | 87.1 | 86.3% | 38 | 0 |
| Q3 FY2027 (Oct 2026) | 2.35 | 81.0% | 103.1 | 80.9% | 40 | 0 |
Legend: Sell-side analyst consensus estimates for NVDA as of June 2026. EPS in USD per share; revenue in USD billions. "Downward Revisions (30d)" = number of analysts who lowered estimates in the past 30 days. Source: aggregated analyst estimates, 50+ covering analysts.
The single most decisive datum in this table is the final column: zero downward EPS revisions across all forward periods in the trailing 30 days. Every revision — across the current quarter, the next quarter, the current fiscal year, and the following fiscal year — was upward. Four analysts raised FY2027 estimates in the last 30 days; eight raised FY2028 estimates; none lowered either. This is not a consensus drifting toward caution. It is a consensus converging upward, which means the market's forward earnings expectations are still adjusting higher, not lower, as of the investment decision date.
At a share price of approximately 225.30 (as of June 1, 2026), the forward P/E on FY2027 consensus EPS of 9.00 computes to 25.0x — and on FY2028 consensus EPS of $12.89, it computes to 17.5x. The PEG ratio on FY2027 is 0.28 (25.0 / 88.6); on FY2028 it is 0.40 (17.5 / 43.3). Both figures sit far below the 1.0 threshold that conventional valuation frameworks treat as the boundary between fair value and undervaluation. There is no growth assumption under which these PEG ratios signal overvaluation.
The revenue comparison across semiconductor peers, using the most recent SEC filings, establishes the scale of NVIDIA's competitive dominance:
| Company | Most Recent Annual Revenue (B) | H1 2026 Revenue (B) | Annualized 2026 Revenue ($B) | NVDA FY2027 Consensus as Multiple |
|---|---|---|---|---|
| NVIDIA | 215.8 (FY2026) | ~91.8 (Q1 FY2027) | ~393.9 (consensus) | — |
| AMD | 25.8 (FY2024) | 21.8 | ~43.6 | 9.0x |
| Intel | 53.1 (FY2024) | 29.7 | ~59.4 | 6.6x |
| Broadcom | 55.9 (FY2025) | 41.5 | ~83.0 | 4.7x |
Legend: Revenue comparison across major US semiconductor companies. NVIDIA FY2026 revenue from 10-K filed Feb 2026; peer data from most recent 10-Q filings (H1 2026 = first six months of calendar 2026). "NVDA FY2027 Consensus as Multiple" = NVDA's consensus FY2027 revenue divided by each peer's annualized 2026 revenue. Source: SEC filings.
NVIDIA's consensus FY2027 revenue of 393.9B would exceed the combined annualized revenue of AMD, Intel, and Broadcom (186.0B) by more than 2.1x. This is not a company facing competitive erosion within a 12-month window — it is a company whose revenue base is an order of magnitude larger than its nearest competitors and still growing at 82%.
The negative side raised five distinct risks. An honest assessment requires engaging each on its merits:
Valuation compression (the opponent's strongest argument). This was the centerpiece of the negative case, and it received the most forceful rebuttal in Round 2. The opponent claimed NVDA's forward P/E sat "well above the 10-year semiconductor sector average." The data shows the opposite: NVDA's forward P/E of 17.5x (on FY2028 consensus) sits below Broadcom (21.4x), Texas Instruments (26.3x), AMD (31.2x), Applied Materials (29.9x), and the semiconductor sector median of approximately 30x. The PEG ratio of 0.28–0.40 is deeply undervalued by any conventional standard. The opponent's concern would carry weight if NVDA traded at 40–50x forward earnings with single-digit growth — but the actual arithmetic shows a company trading at a discount to slower-growing peers while delivering 80%+ earnings growth. This counter-argument, while structurally valid as a risk category, is factually inapplicable to NVDA's current valuation as of June 2026.
Customer concentration. This is a legitimate structural observation — hyperscalers (Microsoft, Meta, Alphabet, Amazon) account for a substantial portion of data-center revenue. However, the analyst consensus for FY2027 revenue (393.9B, +82.4% growth) and FY2028 revenue (561.5B, +42.6% growth) already incorporates the known customer base and its capex trajectory. The risk would materialize only if hyperscaler capex guidance were revised downward materially within the holding period — and the zero-downward-revision trend across 50+ analysts suggests the sell-side community, which tracks hyperscaler capex closely, sees no such inflection. The concentration risk is real but is not priced as imminent by the informed market.
Custom silicon competition (TPU, Trainium, Maia). This is the opponent's most forward-looking and intellectually honest concern. Google's TPU, Amazon's Trainium, and Microsoft's Maia are in production deployment. However, three structural facts limit the 12-month materiality: (1) custom silicon primarily serves internal inference workloads, not the training workloads that drive the highest-value GPU purchases; (2) NVIDIA's CUDA ecosystem represents a 15-year software moat that custom silicon cannot replicate — migration costs and developer lock-in are substantial; (3) the revenue multiples in the table above show that even if custom silicon captured 20% of incremental AI compute spend, NVIDIA's revenue base would still dwarf all competitors combined. The custom silicon threat is a multi-year structural watch item, not a 12-month decision-changing risk
Round 3
--- OPPONENT'S ARGUMENTS — Affirmative (TRUE side), round 3 (MANDATORY CONTEXT) ---
Core claim: NVDA's explosive earnings growth, fortress balance sheet, and structural AI demand make a 12-month hold sound.
[Facet: Large Cap]
The affirmative side's central thesis rests on NVIDIA's earnings growth, and the analyst consensus data obtained for this synthesis provides independent, market-based confirmation that the trajectory is not merely a backward-looking extrapolation. Fifty to fifty-five sell-side analysts covering NVDA produce the following forward estimates:
| Period | Consensus EPS () | YoY Growth (%) | Consensus Revenue (B) | Revenue YoY Growth (%) | Analysts | Downward Revisions (30d) |
|---|---|---|---|---|---|---|
| FY2027 (Jan 2027) — Current | 9.00 | 88.6% | 393.9 | 82.4% | 50 | 0 |
| FY2028 (Jan 2028) — +1y | 12.89 | 43.3% | 561.5 | 42.6% | 50 | 0 |
| Q2 FY2027 (Jul 2026) | 1.96 | 86.7% | 87.1 | 86.3% | 38 | 0 |
| Q3 FY2027 (Oct 2026) | 2.35 | 81.0% | 103.1 | 80.9% | 40 | 0 |
Legend: Sell-side analyst consensus estimates for NVDA as of June 2026. EPS in USD per share; revenue in USD billions. "Downward Revisions (30d)" = number of analysts who lowered estimates in the past 30 days. Source: aggregated analyst estimates, 50+ covering analysts.
The single most decisive datum in this table is the final column: zero downward EPS revisions across all forward periods in the trailing 30 days. Every revision — across the current quarter, the next quarter, the current fiscal year, and the following fiscal year — was upward. Four analysts raised FY2027 estimates in the last 30 days; eight raised FY2028 estimates; none lowered either. This is not a consensus drifting toward caution. It is a consensus converging upward, which means the market's forward earnings expectations are still adjusting higher, not lower, as of the investment decision date.
At a share price of approximately 225.30 (as of June 1, 2026), the forward P/E on FY2027 consensus EPS of 9.00 computes to 25.0x — and on FY2028 consensus EPS of $12.89, it computes to 17.5x. The PEG ratio on FY2027 is 0.28 (25.0 / 88.6); on FY2028 it is 0.40 (17.5 / 43.3). Both figures sit far below the 1.0 threshold that conventional valuation frameworks treat as the boundary between fair value and undervaluation. There is no growth assumption under which these PEG ratios signal overvaluation.
The revenue comparison across semiconductor peers, using the most recent SEC filings, establishes the scale of NVIDIA's competitive dominance:
| Company | Most Recent Annual Revenue (B) | H1 2026 Revenue (B) | Annualized 2026 Revenue ($B) | NVDA FY2027 Consensus as Multiple |
|---|---|---|---|---|
| NVIDIA | 215.8 (FY2026) | ~91.8 (Q1 FY2027) | ~393.9 (consensus) | — |
| AMD | 25.8 (FY2024) | 21.8 | ~43.6 | 9.0x |
| Intel | 53.1 (FY2024) | 29.7 | ~59.4 | 6.6x |
| Broadcom | 55.9 (FY2025) | 41.5 | ~83.0 | 4.7x |
Legend: Revenue comparison across major US semiconductor companies. NVIDIA FY2026 revenue from 10-K filed Feb 2026; peer data from most recent 10-Q filings (H1 2026 = first six months of calendar 2026). "NVDA FY2027 Consensus as Multiple" = NVDA's consensus FY2027 revenue divided by each peer's annualized 2026 revenue. Source: SEC filings.
NVIDIA's consensus FY2027 revenue of 393.9B would exceed the combined annualized revenue of AMD, Intel, and Broadcom (186.0B) by more than 2.1x. This is not a company facing competitive erosion within a 12-month window — it is a company whose revenue base is an order of magnitude larger than its nearest competitors and still growing at 82%.
The negative side raised five distinct risks. An honest assessment requires engaging each on its merits:
Valuation compression (the opponent's strongest argument). This was the centerpiece of the negative case, and it received the most forceful rebuttal in Round 2. The opponent claimed NVDA's forward P/E sat "well above the 10-year semiconductor sector average." The data shows the opposite: NVDA's forward P/E of 17.5x (on FY2028 consensus) sits below Broadcom (21.4x), Texas Instruments (26.3x), AMD (31.2x), Applied Materials (29.9x), and the semiconductor sector median of approximately 30x. The PEG ratio of 0.28–0.40 is deeply undervalued by any conventional standard. The opponent's concern would carry weight if NVDA traded at 40–50x forward earnings with single-digit growth — but the actual arithmetic shows a company trading at a discount to slower-growing peers while delivering 80%+ earnings growth. This counter-argument, while structurally valid as a risk category, is factually inapplicable to NVDA's current valuation as of June 2026.
Customer concentration. This is a legitimate structural observation — hyperscalers (Microsoft, Meta, Alphabet, Amazon) account for a substantial portion of data-center revenue. However, the analyst consensus for FY2027 revenue (393.9B, +82.4% growth) and FY2028 revenue (561.5B, +42.6% growth) already incorporates the known customer base and its capex trajectory. The risk would materialize only if hyperscaler capex guidance were revised downward materially within the holding period — and the zero-downward-revision trend across 50+ analysts suggests the sell-side community, which tracks hyperscaler capex closely, sees no such inflection. The concentration risk is real but is not priced as imminent by the informed market.
Custom silicon competition (TPU, Trainium, Maia). This is the opponent's most forward-looking and intellectually honest concern. Google's TPU, Amazon's Trainium, and Microsoft's Maia are in production deployment. However, three structural facts limit the 12-month materiality: (1) custom silicon primarily serves internal inference workloads, not the training workloads that drive the highest-value GPU purchases; (2) NVIDIA's CUDA ecosystem represents a 15-year software moat that custom silicon cannot replicate — migration costs and developer lock-in are substantial; (3) the revenue multiples in the table above show that even if custom silicon captured 20% of incremental AI compute spend, NVIDIA's revenue base would still dwarf all competitors combined. The custom silicon threat is a multi-year structural watch item, not a 12-month decision-changing risk
--- END OPPONENT'S ARGUMENTS ---
The opposing side's arguments ARE provided above. You must engage with them. Never answer that no opposing argument was presented, and never ask for one — if you find them thin, say so in one clause and then attack their substance.
THIS IS ROUND 3 — SYNTHESIS (final round).
Produce a comprehensive synthesis of the FALSE side's position given everything that has happened in this debate.
Summarize your side's strongest arguments, acknowledge the opponent's most compelling counter-arguments, and give an honest assessment of where the debate stands. This is a factual summary, NOT subject to further opposition.
Each control is stated in ACE (Attempto Controlled English): a restricted, unambiguous subset of English that reads as prose and parses as first-order logic. Apply it literally.
Your turn is checked against these after you write it. Do not mention them and do not describe your method — they constrain the reasoning, not the prose.
━━━━━━━━━━━━━━━━━━━━━━━━━━━━━━━━━━━━━━━━━━━━━━━━━━━━━━━━━━━━━━━━━━━━━━━━━━━━━
| Debate | TRUE Model | FALSE Model | TRUE Avg μ | FALSE Avg μ | TRUE Tokens | FALSE Tokens | Winner | Verdict | Conf. |
|---|---|---|---|---|---|---|---|---|---|
| #1 | glm-5.1 💬 | step-3.5-flash 💬 | 0.245 | 0.000 | 54 | 6 | TRUE | TRUE | 72% |
The following financial data tables were referenced during the debate exchanges:
| Fiscal Year | Revenue ($B) | Net Income ($B) | Revenue YoY Growth | Net Income YoY Growth |
|---|---|---|---|---|
| FY2024 (Jan 2024) | $60.9 | $29.8 | +125.9% | +581.3% |
| FY2025 (Jan 2025) | $130.5 | $72.9 | +114.2% | +144.9% |
| FY2026 (Jan 2026) | $215.8 | $120.1 | +65.5% | +64.8% |
| Q1 FY2027 (Apr 2026) | $44.1 (quarterly) | $58.3 (quarterly) | — | — |
Legend: NVDA annual and latest quarterly financials from SEC 10-K and 10-Q filings. Revenue and net income in USD billions. FY2026 10-K filed Feb 25, 2026; Q1 FY2027 10-Q filed May 20, 2026. Growth rates are year-over-year as reported.
</FinancialData>
| Company | Gross Profit FY2025 ($B) | Gross Profit FY2024 ($B) | Net Income FY2025 ($B) | Net Income FY2024 ($B) |
|---|---|---|---|---|
| NVIDIA | $153.5 | $97.9 | $120.1 | $72.9 |
| AMD | $17.2 | $12.7 | $3.7 | $1.6 |
| Intel | $11.9 | $8.2 | -$14.8 | -$3.7 |
Legend: Annual gross profit and net income for major US semiconductor companies, FY2025 vs FY2024 (calendar-aligned). Figures in USD billions. Intel reported net losses in both periods. Source: SEC 10-K and 10-Q filings.
</FinancialData>
| Company | Forward P/E | TTM EPS ($/sh) | Forward EPS ($/sh) | Price ($/sh) |
|---|---|---|---|---|
| NVIDIA (NVDA) | 17.58 | 6.56 | 12.82 | 225.30 |
| AMD | 31.24 | 3.91 | 15.46 | 483.01 |
| Intel (INTC) | 51.25 | -2.16 | 2.04 | 104.56 |
| Marvell (MRVL) | 35.59 | 2.98 | 6.24 | 222.18 |
| Astera Labs (ALAB) | 50.48 | 2.07 | 6.39 | 322.78 |
| Lam Research (LRCX) | 29.16 | 5.97 | 11.56 | 337.01 |
| Applied Materials (AMAT) | 29.85 | 10.37 | 17.91 | 534.54 |
| KLA Corp (KLAC) | 31.86 | 3.68 | 6.57 | 209.37 |
| Teradyne (TER) | 35.53 | 7.43 | 11.55 | 410.52 |
| Broadcom (AVGO) | 21.39 | 6.02 | 19.53 | 417.91 |
| Texas Instruments (TXN) | 26.28 | 6.51 | 10.40 | 273.43 |
Legend: Forward P/E and EPS for major US-listed semiconductor companies as of June 1, 2026. Forward P/E = price / forward EPS estimate. NVDA trades at the lowest forward multiple among AI-exposed peers and below the sector median of ~30. Source: market data and SEC filings.
</FinancialData>
| Period | Consensus EPS ($) | YoY Growth (%) | Consensus Revenue ($B) | Revenue YoY Growth (%) | Analysts | Downward Revisions (30d) |
|---|---|---|---|---|---|---|
| FY2027 (Jan 2027) — Current | 9.00 | 88.6% | 393.9 | 82.4% | 50 | 0 |
| FY2028 (Jan 2028) — +1y | 12.89 | 43.3% | 561.5 | 42.6% | 50 | 0 |
| Q2 FY2027 (Jul 2026) | 1.96 | 86.7% | 87.1 | 86.3% | 38 | 0 |
| Q3 FY2027 (Oct 2026) | 2.35 | 81.0% | 103.1 | 80.9% | 40 | 0 |
Legend: Sell-side analyst consensus estimates for NVDA as of June 2026. EPS in USD per share; revenue in USD billions. "Downward Revisions (30d)" = number of analysts who lowered estimates in the past 30 days. Source: aggregated analyst estimates, 50+ covering analysts.
</FinancialData>
| Company | Most Recent Annual Revenue ($B) | H1 2026 Revenue ($B) | Annualized 2026 Revenue ($B) | NVDA FY2027 Consensus as Multiple |
|---|---|---|---|---|
| NVIDIA | 215.8 (FY2026) | ~91.8 (Q1 FY2027) | ~393.9 (consensus) | — |
| AMD | 25.8 (FY2024) | 21.8 | ~43.6 | 9.0x |
| Intel | 53.1 (FY2024) | 29.7 | ~59.4 | 6.6x |
| Broadcom | 55.9 (FY2025) | 41.5 | ~83.0 | 4.7x |
Legend: Revenue comparison across major US semiconductor companies. NVIDIA FY2026 revenue from 10-K filed Feb 2026; peer data from most recent 10-Q filings (H1 2026 = first six months of calendar 2026). "NVDA FY2027 Consensus as Multiple" = NVDA's consensus FY2027 revenue divided by each peer's annualized 2026 revenue. Source: SEC filings.
</FinancialData>
Debate Transcripts
- ■
Ownership & Trade Secrets. The Company Lambda Vision retains all rights to its platform, agentic workflows, and proprietary financial methodologies, which constitute protected Trade Secrets (EU Directive 2016/943). Subject to full payment of tokens, the User is granted ownership of the generated Reports for their own professional use. Reverse-engineering the Service or using Reports to train competing AI models is strictly prohibited.
- ■
No Financial Advice. The Service and Reports are for informational purposes only and do not constitute financial, investment, legal, or tax advice. The Company is not a regulated financial advisor. AI-generated outputs may contain errors; the User is solely responsible for verifying data and assumes all risks for any financial decisions or losses.
- ■
Liability & Governing Law. To the maximum extent permitted by law, the Company shall not be liable for any indirect or financial damages. These Terms are governed by French law. Any disputes shall be subject to the exclusive jurisdiction of the Courts of Paris, France.