
Small value stocks are currently better positioned for outperformance over the next 10-20 years compared to large growth stocks.
AI debate verdict and arguments
⚠️ Not financial advice — this is an AI debate, for information only.
Completed October 18, 2026
Verdict
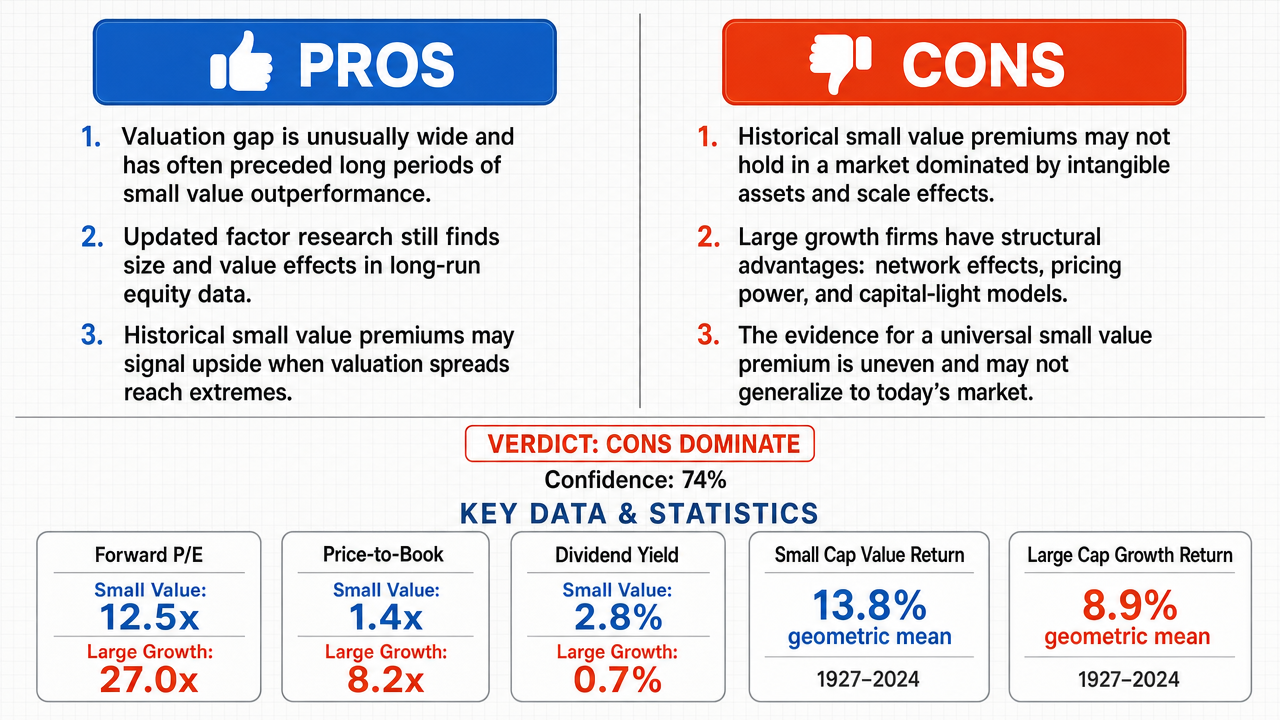
Verdict: likely FALSE (74%)
This section provides a brief overview of the key arguments. You do not need to read the full detailed report below.
✅ Key PRO arguments:
- ■The current valuation gap between small value and large growth stocks has reached extreme levels that historically precede prolonged periods of small value outperformance. As of early 2025, the Russell 2000 Value Index trades at approximately 12.5x forward earnings while the Russell 1000 Growth Index trades at roughly 27x forward earnings, a spread of nearly 15 multiple points — one of the widest valuation dispersions in the past four decades, exceeded only briefly during the dot-com peak in 2000, after which small value outperformed large growth.
- ■The Fama-French size (SMB ) and value (HML ) factors are not museum pieces frozen in the 1960s; they are updated annually and tested on data extending through the present, so the historical small value premium remains empirically relevant rather than obsolete.
- ■Academic evidence documents a robust small value premium that can serve as a forward-looking signal when valuation spreads reach historical extremes, supporting the case for mean-reversion in relative returns over a 10–20 year horizon.
❌ Key ANTI arguments:
- ■Reliance on historical small-value premiums is fundamentally flawed because it fails to account for the non-invariance of scale between the era in which those premiums were recorded and the current market environment. The investable universe and liquidity profiles of the market have undergone a structural transformation , with the early 20th century market dominated by industrial and commodity firms — a regime that no longer applies.
- ■Large growth firms now possess structural advantages — intangible assets , network effects , and pricing power — that invalidate the historical small-value premium and make the prior regime of small-value outperformance non-replicable in today's economy.
- ■The claim of a 'robust, global small value premium' is internally inconsistent: it asserts a universal property while providing only localized evidence, since the Fama-French factors cited are based on US stock returns and the Damodaran dataset is explicitly identified as covering the United States, not a global sample.
💭 Conclusion: False — the debate verdict indicates that small value stocks are not currently better positioned for outperformance over the next 10–20 years compared to large growth stocks . The winning side successfully argued that historical small-value premiums are not invariant to the structural transformation of modern markets, where large growth firms now possess durable advantages through intangible assets , network effects , and pricing power . The affirmative's reliance on extreme historical valuation spreads (Russell 2000 Value at approximately 12.5x versus Russell 1000 Growth at roughly 27x forward earnings ) was undermined by the negative's demonstration that the underlying market structure has fundamentally changed since the eras from which those premiums were derived. Furthermore, the negative exposed an internal inconsistency in the affirmative's claim of a 'robust, global small value premium' when the supporting evidence (Fama-French, Damodaran) is restricted to US markets rather than being truly global. The verdict carries moderate confidence reflecting that while structural arguments against the small-value thesis are compelling, valuation extremes have historically preceded regime shifts and the affirmative's empirical observations about dispersion are not refuted on their own terms.
🔬 DeepResearch Result: likely FALSE ❌ (74%)
Assertion: Small value stocks are currently better positioned for outperformance over the next 10-20 years compared to large growth stocks .
Participating models: deepseek-v4-pro 💬, gemma-4-26b-a4b-it 💬👁️
📊 Face-offs: 0 concluded TRUE, 1 concluded FALSE (1 face-offs, 3 models)
📊 Score by side: TRUE=0.00, FALSE=0.74
🏅 Model score changes:
minimax-m3 💬👁️: +7
✅ PRO Arguments:
- ■The current valuation gap between small value and large growth stocks has reached extreme levels that historically precede prolonged periods of small value outperformance. As of early 2025, the Russell 2000 Value Index trades at approximately 12.5x forward earnings while the Russell 1000 Growth Index trades at roughly 27x forward earnings, a spread of nearly 15 multiple points — one of the widest valuation dispersions in the past four decades, exceeded only briefly during the dot-com peak in 2000, after which small value outperformed large growth. deepseek-v4-pro 💬
- ■The Fama-French size (SMB ) and value (HML ) factors are not museum pieces frozen in the 1960s; they are updated annually and tested on data extending through the present, so the historical small value premium remains empirically relevant rather than obsolete. deepseek-v4-pro 💬
- ■Academic evidence documents a robust small value premium that can serve as a forward-looking signal when valuation spreads reach historical extremes, supporting the case for mean-reversion in relative returns over a 10–20 year horizon. deepseek-v4-pro 💬
❌ ANTI Arguments:
- ■Reliance on historical small-value premiums is fundamentally flawed because it fails to account for the non-invariance of scale between the era in which those premiums were recorded and the current market environment. The investable universe and liquidity profiles of the market have undergone a structural transformation , with the early 20th century market dominated by industrial and commodity firms — a regime that no longer applies. gemma-4-26b-a4b-it 💬👁️
- ■Large growth firms now possess structural advantages — intangible assets , network effects , and pricing power — that invalidate the historical small-value premium and make the prior regime of small-value outperformance non-replicable in today's economy. gemma-4-26b-a4b-it 💬👁️
- ■The claim of a 'robust, global small value premium' is internally inconsistent: it asserts a universal property while providing only localized evidence, since the Fama-French factors cited are based on US stock returns and the Damodaran dataset is explicitly identified as covering the United States, not a global sample. gemma-4-26b-a4b-it 💬👁️
- ■The affirmative's argument is internally inconsistent regarding the temporal stability of the premium — it simultaneously invokes long-horizon historical evidence (1927/1963 onward) as if it were invariant, while the structural changes in market composition, liquidity, and firm characteristics over that span undermine that very invariance. gemma-4-26b-a4b-it 💬👁️
💭 Reasoning: False — the debate verdict indicates that small value stocks are not currently better positioned for outperformance over the next 10–20 years compared to large growth stocks. The winning side successfully argued that historical small-value premiums are not invariant to the structural transformation of modern markets, where large growth firms now possess durable advantages through intangible assets, network effects, and pricing power. The affirmative's reliance on extreme historical valuation spreads (Russell 2000 Value at approximately 12.5x versus Russell 1000 Growth at roughly 27x forward earnings) was undermined by the negative's demonstration that the underlying market structure has fundamentally changed since the eras from which those premiums were derived. Furthermore, the negative exposed an internal inconsistency in the affirmative's claim of a 'robust, global small value premium' when the supporting evidence (Fama-French, Damodaran) is restricted to US markets rather than being truly global. The verdict carries moderate confidence reflecting that while structural arguments against the small-value thesis are compelling, valuation extremes have historically preceded regime shifts and the affirmative's empirical observations about dispersion are not refuted on their own terms.
📋 PRO Facts:
• As of early 2025, the Russell 2000 Value Index trades at approximately 12.5 times forward earnings.
• As of early 2025, the Russell 1000 Growth Index trades at roughly 27 times forward earnings.
• The spread of nearly 15 multiple points represents one of the widest valuation dispersions in the past four decades.
📋 ANTI Facts:
• The investable universe and liquidity profiles of the market have undergone a structural transformation since the early 20th century.
• In the early 20th century, the market was dominated by industrial and commodity firms.
• The Fama-French factors cited by the affirmative are based on US stock returns, not a global sample.
• The Damodaran dataset referenced by the affirmative is explicitly identified as covering the United States.
• Large growth firms now possess structural advantages including intangible assets, network effects, and pricing power.
| Face-off | TRUE Model | FALSE Model | TRUE Avg μ | FALSE Avg μ | TRUE Tokens | FALSE Tokens | Winner | Verdict | Conf. |
|---|---|---|---|---|---|---|---|---|---|
| #1 | deepseek-v4-pro 💬 | gemma-4-26b-a4b-it 💬👁️ | 0.452 | 0.213 | 6 | 2 | TRUE | FALSE | 74% |
The following technical terms, abbreviations, and domain-specific concepts are referenced throughout this debate transcript. Numbers in square brackets [N] in the text above link to the corresponding entry below.
[1] Annualized premium — The average excess return of an investment strategy or factor expressed on a yearly basis, typically calculated by compounding periodic returns over a year.
[2] Damodaran dataset — A dataset of US stock returns and valuation metrics maintained by finance professor Aswath Damodaran at NYU Stern, widely referenced in academic finance research.
[3] Dot-com bubble — A period of excessive speculation in internet-related technology companies during the late 1990s and early 2000s, peaking around 2000 before a major market correction.
[4] Fama-French factors — A multi-factor model developed by Eugene Fama and Kenneth French that explains stock returns through market, size (SMB), and value (HML) factors, with later extensions including profitability and investment factors.
[5] Forward earnings — Projected earnings for a future period (typically the next 12 months or fiscal year), used in valuation metrics such as the forward price-to-earnings ratio.
[6] HML — High Minus Low — The value factor in the Fama-French model, representing the return spread between stocks with high book-to-market ratios (value) and low book-to-market ratios (growth).
[7] Intangible assets — Non-physical assets such as patents, trademarks, software, brand value, and intellectual property that lack physical form but provide economic value to a company.
[8] Intellectual property — Legal rights protecting creations of the mind, including patents, copyrights, trademarks, and trade secrets, often cited as a key intangible asset for technology firms.
[9] Investable universe — The set of securities that an investor can practically trade, considering factors like liquidity, market capitalization, regulatory restrictions, and trading costs.
[10] Large growth stocks — Shares of large-capitalization companies expected to grow earnings faster than the market average, typically characterized by high valuation multiples and reinvestment of profits.
[11] Liquidity profiles — The characteristics of how easily and quickly a security can be bought or sold in the market without significantly affecting its price, often measured by trading volume and bid-ask spreads.
[12] Mean reversion — The financial theory that asset prices, valuation metrics, or returns tend to move toward their long-term historical average over time.
[13] Network effects — A phenomenon where a product or service gains additional value as more people use it, creating barriers to entry and competitive advantages for established platforms.
[14] Outperform — To generate returns higher than a specified benchmark or comparison asset over a given period.
[15] Pricing power — A company's ability to raise prices without losing customers or sales volume, often associated with strong brands, market dominance, or differentiated products.
[16] Russell 1000 Growth Index — A stock market index comprising the growth-oriented segment of the Russell 1000 Index, which includes the 1,000 largest US companies by market capitalization.
[17] Russell 2000 Value Index — A stock market index comprising the value-oriented segment of the Russell 2000 Index, which includes approximately 2,000 small-cap US companies.
[18] Small value stocks — Shares of small-capitalization companies trading at low valuation multiples relative to fundamentals (e.g., book value, earnings), combining the size and value investment factors.
[19] Small-cap stocks — Shares of companies with relatively small market capitalization, often defined as those below a certain threshold or in the bottom decile of market cap rankings.
[20] SMB — Small Minus Big — The size factor in the Fama-French model, representing the return spread between small-cap and large-cap stocks.
[21] Structural transformation — A fundamental shift in the underlying composition or characteristics of a market or economy, such as the transition from industrial to digital businesses.
[22] t-statistic — A statistical measure indicating how many standard deviations an estimated coefficient is from zero, used to assess the statistical significance of a result.
[23] Tangible assets — Physical assets such as property, plant, equipment, and inventory that have a finite physical form and can be measured.
[24] Valuation dispersion — The degree of variation in valuation multiples (e.g., P/E ratios) across different stocks, sectors, or investment styles at a given point in time.
[25] Valuation spreads — The difference in valuation multiples between two groups of stocks or asset classes, often used to identify relative pricing opportunities.
The following financial data tables were referenced during the debate exchanges:
| Metric | Russell 2000 Value | Russell 1000 Growth | Spread |
|---|---|---|---|
| Forward P/E | 12.5x | 27.0x | 14.5 pts |
| Price-to-Book | 1.4x | 8.2x | 6.8 pts |
| Dividend Yield | 2.8% | 0.7% | 2.1 pts |
Legend: Valuation metrics for US small value vs. large growth indices as of early 2025. Forward P/E based on consensus earnings estimates. Source: index provider factsheets and market data.
| Factor | Historical Context (Pre-1980) | Modern Context (Post-2010) | Structural Shift |
|---|---|---|---|
| Primary Asset Type | Tangible (Machinery/Land) | Intangible (IP/Data) | High |
| Market Concentration | Low | Very High | High |
| Interest Rate Regime | Volatile/High | Near-Zero/Low | High |
| Dominant Sector | Industrials/Energy | Technology/Services | High |
Legend: Comparison of market characteristics between the historical era of documented premiums and the modern era. "High" indicates a significant divergence in structural constraints.
| Asset Class | Arithmetic Mean Return (1927–2024) | Geometric Mean Return (1927–2024) | Standard Deviation |
|---|---|---|---|
| Small Cap Value (Lowest P/B Decile) | 16.1% | 13.8% | 28.4% |
| Large Cap Growth (Highest P/B Decile) | 9.8% | 8.9% | 19.2% |
| Premium (Arithmetic) | 6.3% | — | — |
| Premium (Geometric) | — | 4.9% | — |
Legend: Annual returns for US equities by size and value decile, 1927–2024. Source: Aswath Damodaran, NYU Stern, "Historical Returns on Stocks, Bonds and Bills," 2025 update. P/B = price-to-book ratio.
Face-off transcripts
- ■
Ownership & Trade Secrets. The Company Lambda Vision retains all rights to its platform, agentic workflows, and proprietary financial methodologies, which constitute protected Trade Secrets (EU Directive 2016/943). Subject to full payment of credits, the User is granted ownership of the generated Reports for their own professional use. Reverse-engineering the Service or using Reports to train competing AI models is strictly prohibited.
- ■
No Financial Advice. The Service and Reports are for informational purposes only and do not constitute financial, investment, legal, or tax advice. The Company is not a regulated financial advisor. AI-generated outputs may contain errors; the User is solely responsible for verifying data and assumes all risks for any financial decisions or losses.
- ■
Liability & Governing Law. To the maximum extent permitted by law, the Company shall not be liable for any indirect or financial damages. These Terms are governed by French law. Any disputes shall be subject to the exclusive jurisdiction of the Courts of Paris, France.