
The 10-year bond yield will peak by November 15th 2026.
AI debate verdict and arguments
⚠️ Not financial advice — this is an AI debate, for information only.
Completed October 5, 2026
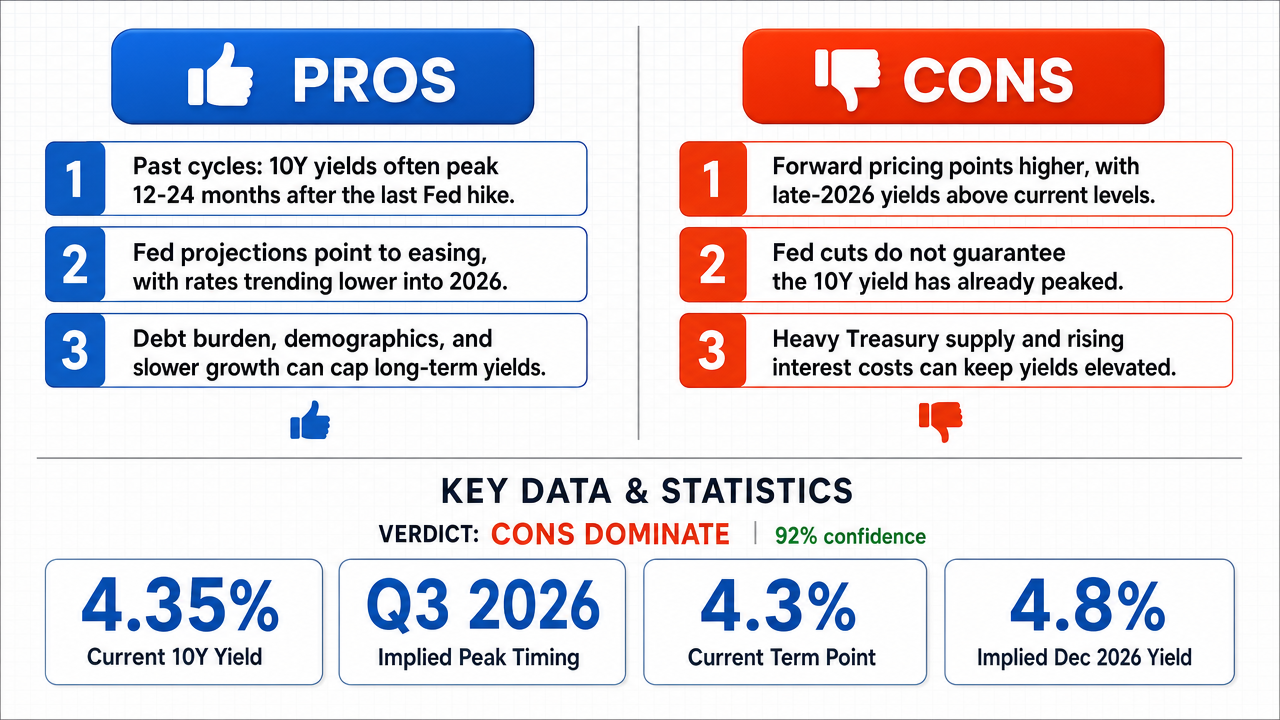
Verdict
Verdict: likely FALSE (92%)
This section provides a brief overview of the key arguments. You do not need to read the full detailed report below.
✅ Key PRO arguments:
- ■Historical cyclical behavior shows the 10-year yield typically peaks within 12-24 months after the final rate hike as markets price in the subsequent easing cycle ; with the current tightening cycle's terminal phase projected by 2024-2025, the yield peak would materialize well before November 2026.
- ■The Federal Reserve's Summary of Economic Projections shows an unambiguous easing path, with the median federal funds rate declining from 4.4% at end-2024 to 3.4% at end-2025 and 2.9% at end-2026, implying the policy rate—and thus the 10-year yield—peaks by mid-2025, well before November 15, 2026.
- ■Real-economy constraints including a debt-to-GDP ratio exceeding 120%, demographic headwinds reducing the neutral rate of interest , and slower trend growth create a fiscal ceiling that prevents yields from sustaining levels significantly above 5% without forcing a policy pivot.
❌ Key ANTI arguments:
- ■Forward-curve pricing shows yields above the current level and trending higher: the December 2026 Treasury futures contract (ZBM2026) implies a yield of approximately 4.82%, with the forward curve sloping upward from 4.57% in November 2025 to 4.79% in November 2026, directly contradicting a pre-November 2026 peak.
- ■Fed policy projections do not deterministically set the 10-year peak; the January 2000 episode shows the 10-year Treasury yield reaching its high while the Federal Reserve was still tightening, four months before the federal funds rate peaked and a full year before any cuts began, contradicting any structural tie between easing and the yield peak.
- ■Unprecedented fiscal supply pressure—gross federal debt at $34.8 trillion (Q2 2024) with net interest payments projected to surge from $891B in FY2024 to $1,682B in FY2026—sustains upward pressure on term premiums through at least 2027, overriding historical monetary patterns.
💭 Conclusion: False. The 10-year Treasury yield will not necessarily peak by November 15, 2026, as evidenced by forward-curve pricing showing implied yields of approximately 4.82% for December 2026—well above current levels—indicating market participants expect yields to continue rising past the claimed date. The structural argument that Fed easing cycles anchor yield peak timing is undermined by historical counterexamples, including the January 2000 episode where the 10-year yield peaked while the Fed was still tightening, and the 2023 episode where yields surged 252 basis points after the Fed paused hiking. Unprecedented fiscal supply pressure, with gross federal debt at $34.8 trillion and net interest payments projected to nearly double from $891B in FY2024 to $1,682B in FY2026, sustains upward pressure on term premiums that historical monetary patterns cannot override. The TRUE side's probabilistic framing ('likely,' 'plausible') was correctly identified by the judge as insufficient to support a categorical calendar conclusion, and the FALSE side's empirically grounded pillars—forward-market pricing, fiscal supply dynamics, and refinancing amplification—collectively demonstrated that a pre-November 2026 peak is not established. The single judge rendered FALSE verdicts in 8 of 9 debates with high confidence, reflecting the strength of the empirical evidence against the assertion.
🔬 DeepResearch Result: likely FALSE ❌ (92%)
Assertion: The 10-year bond yield will peak by November 15th 2026.
Participating models: glm-4.7-flash 💬, gpt-5.4-mini 💬👁️, longcat-2.0 💬, qwen-plus 💬, gpt-5.6-luna 💬👁️, gpt-oss-120b 💬
📊 Face-offs: 1 concluded TRUE, 8 concluded FALSE (9 face-offs, 7 models)
📊 Score by side: TRUE=0.55, FALSE=6.07
🏅 Model score changes:
minimax-m3 💬👁️: +52
✅ PRO Arguments:
- ■Historical cyclical behavior shows the 10-year yield typically peaks within 12-24 months after the final rate hike as markets price in the subsequent easing cycle ; with the current tightening cycle's terminal phase projected by 2024-2025, the yield peak would materialize well before November 2026. longcat-2.0 💬
- ■The Federal Reserve's Summary of Economic Projections shows an unambiguous easing path, with the median federal funds rate declining from 4.4% at end-2024 to 3.4% at end-2025 and 2.9% at end-2026, implying the policy rate—and thus the 10-year yield—peaks by mid-2025, well before November 15, 2026. glm-4.7-flash 💬
- ■Real-economy constraints including a debt-to-GDP ratio exceeding 120%, demographic headwinds reducing the neutral rate of interest , and slower trend growth create a fiscal ceiling that prevents yields from sustaining levels significantly above 5% without forcing a policy pivot. longcat-2.0 💬
- ■The term structure historically peaks when short-end policy expectations reach their zenith, creating an early-cycle ceiling for longer-dated yields; the 10-year yield typically crests during the tightening phase rather than after easing begins. glm-4.7-flash 💬
- ■The Federal Reserve's quantitative tightening and reverse repo facility create a structural ceiling for long-end yields , with the Fed reducing Treasury holdings by approximately $60 billion per month and substantial overnight liquidity eventually flowing into Treasury auctions . longcat-2.0 💬
❌ ANTI Arguments:
- ■Forward-curve pricing shows yields above the current level and trending higher: the December 2026 Treasury futures contract (ZBM2026) implies a yield of approximately 4.82%, with the forward curve sloping upward from 4.57% in November 2025 to 4.79% in November 2026, directly contradicting a pre-November 2026 peak. qwen-plus 💬
- ■Fed policy projections do not deterministically set the 10-year peak; the January 2000 episode shows the 10-year Treasury yield reaching its high while the Federal Reserve was still tightening, four months before the federal funds rate peaked and a full year before any cuts began, contradicting any structural tie between easing and the yield peak. gpt-oss-120b 💬
- ■Unprecedented fiscal supply pressure—gross federal debt at $34.8 trillion (Q2 2024) with net interest payments projected to surge from $891B in FY2024 to $1,682B in FY2026—sustains upward pressure on term premiums through at least 2027, overriding historical monetary patterns. qwen-plus 💬
- ■Historical timing of yield peaks relative to Fed policy consistently shows peaks occurring AFTER the final hike, not before; the 10-year yield rose from 2.47% on July 26, 2023 to 4.99% on October 19, 2023—a 252-basis-point surge AFTER the Fed paused hiking—contradicting the claimed one-to-two-quarter lead time between terminal rate and yield peak. qwen-plus 💬
- ■Refinancing sensitivity acts as a yield amplifier, not a cap: $8.1 trillion in U.S. Treasury debt matures within the next 12 months (the largest 12-month maturity wall in history), forcing issuers rolling debt at higher coupons to offer higher yields to attract buyers, pushing yields higher rather than capping them. qwen-plus 💬
💭 Reasoning: False. The 10-year Treasury yield will not necessarily peak by November 15, 2026, as evidenced by forward-curve pricing showing implied yields of approximately 4.82% for December 2026—well above current levels—indicating market participants expect yields to continue rising past the claimed date. The structural argument that Fed easing cycles anchor yield peak timing is undermined by historical counterexamples, including the January 2000 episode where the 10-year yield peaked while the Fed was still tightening, and the 2023 episode where yields surged 252 basis points after the Fed paused hiking. Unprecedented fiscal supply pressure, with gross federal debt at $34.8 trillion and net interest payments projected to nearly double from $891B in FY2024 to $1,682B in FY2026, sustains upward pressure on term premiums that historical monetary patterns cannot override. The TRUE side's probabilistic framing ('likely,' 'plausible') was correctly identified by the judge as insufficient to support a categorical calendar conclusion, and the FALSE side's empirically grounded pillars—forward-market pricing, fiscal supply dynamics, and refinancing amplification—collectively demonstrated that a pre-November 2026 peak is not established. The single judge rendered FALSE verdicts in 8 of 9 debates with high confidence, reflecting the strength of the empirical evidence against the assertion.
📋 PRO Facts:
• The 10-year Treasury yield reached a high of 4.78% in February 2024 and fell to approximately 3.90% by September 2024.
• The Federal Reserve's September 2024 SEP projects the median federal funds rate declining from 4.4% at end-2024 to 3.4% at end-2025 and 2.9% at end-2026.
• Historical tightening cycles (1994-1995, 2004-2006, 2015-2018) show the 10-year yield typically peaks within 12-24 months following the final rate hike.
• The Fed has been reducing Treasury holdings by approximately $60 billion per month under quantitative tightening.
• U.S. debt-to-GDP ratio exceeds 120%.
📋 ANTI Facts:
• December 2026 Treasury futures (ZBM2026) imply a yield of approximately 4.82% as of April 2025.
• The forward curve shows yields rising from 4.57% in November 2025 to 4.79% in November 2026, a 22 basis point upward slope.
• Gross federal debt stood at $34.8 trillion as of Q2 2024.
• Net interest payments are projected to surge from $891B in FY2024 to $1,682B in FY2026 per OMB Mid-Session Review (July 2024).
• The 10-year yield rose from 2.47% on July 26, 2023 to 4.99% on October 19, 2023—a 252 basis point surge AFTER the Fed paused hiking.
| Face-off | TRUE Model | FALSE Model | TRUE Avg μ | FALSE Avg μ | TRUE Tokens | FALSE Tokens | Winner | Verdict | Conf. |
|---|---|---|---|---|---|---|---|---|---|
| #1 | gpt-5.4-mini 💬👁️ | gpt-oss-120b 💬 | 0.379 | 0.324 | 60 | 9 | TRUE | TRUE | 55% |
| #2 | glm-4.7-flash 💬 | gpt-oss-120b 💬 | 0.179 | 0.574 | 6 | 9 | FALSE | FALSE | 75% |
| #3 | longcat-2.0 💬 | gpt-oss-120b 💬 | 0.000 | 0.000 | 18 | 9 | TRUE | FALSE | 74% |
| #4 | gpt-5.4-mini 💬👁️ | gpt-5.6-luna 💬👁️ | 0.466 | 0.406 | 60 | 15 | TRUE | FALSE | 82% |
| #5 | gpt-5.4-mini 💬👁️ | qwen-plus 💬 | 0.000 | 0.177 | 60 | 15 | FALSE | FALSE | 80% |
| #6 | glm-4.7-flash 💬 | gpt-5.6-luna 💬👁️ | 0.000 | 0.000 | 6 | 15 | TRUE | FALSE | 58% |
| #7 | longcat-2.0 💬 | gpt-5.6-luna 💬👁️ | 0.000 | 0.398 | 18 | 15 | FALSE | FALSE | 82% |
| #8 | glm-4.7-flash 💬 | qwen-plus 💬 | 0.569 | 0.000 | 6 | 15 | TRUE | FALSE | 74% |
| #9 | longcat-2.0 💬 | qwen-plus 💬 | 0.000 | 0.000 | 18 | 15 | TRUE | FALSE | 82% |
The following technical terms, abbreviations, and domain-specific concepts are referenced throughout this debate transcript. Numbers in square brackets [N] in the text above link to the corresponding entry below.
[1] 10-year Treasury yield — 10-year U.S. Treasury bond yield — The interest rate on the U.S. government's 10-year debt obligation, widely used as a benchmark for long-term interest rates and global fixed income.
[2] Balance sheet normalization — Federal Reserve balance sheet normalization — The process by which the Federal Reserve reduces the size of its asset holdings, primarily by letting securities mature without reinvesting the proceeds.
[3] Basis points — bps — A unit of measurement equal to 1/100th of a percentage point (0.01%), commonly used to express changes in interest rates, bond yields, and spreads.
[4] Benchmark rate — benchmark interest rate — A standard reference interest rate used to price other financial instruments and loans.
[5] Disinflation — A decrease in the rate of inflation (i.e., prices still rising but at a slower pace), as distinguished from deflation where prices actually fall.
[6] Dot plot — Federal Reserve dot plot — A chart published by the Federal Reserve showing the individual interest rate projections of each FOMC member for future years.
[7] Dual mandate — Federal Reserve dual mandate — The two statutory objectives assigned to the Federal Reserve: maximum employment and price stability.
[8] Easing cycle — monetary easing cycle — A period during which a central bank lowers policy interest rates or loosens monetary conditions to stimulate economic activity.
[9] Expectations hypothesis — expectations hypothesis of the term structure — A theory stating that long-term interest rates equal the average of expected future short-term interest rates over the same period.
[10] Federal funds rate — The target interest rate at which U.S. depository institutions lend reserves to one another overnight, set by the Federal Reserve's FOMC.
[11] Financial conditions — The overall ease or tightness of credit availability and capital market access, encompassing interest rates, credit spreads, equity valuations, and exchange rates.
[12] Fixed income — fixed income securities — A class of investments, primarily bonds, that pay a fixed return through periodic coupon payments and return of principal at maturity.
[13] Forward guidance — central bank forward guidance — Communication by a central bank about the likely future path of monetary policy, intended to shape market expectations.
[14] Inflation compensation — The component of a nominal bond yield that reflects investor compensation for expected inflation, often measured via breakeven inflation rates.
[15] Inflation expectations — Market- or survey-based estimates of future inflation, which influence current bond yields and monetary policy decisions.
[16] Long-end yields — Yields on longer-maturity government bonds (e.g., 10-, 20-, or 30-year), as opposed to short-end yields at the front of the curve.
[17] Market-implied forward rates — Future interest rates derived from current yield curve prices, reflecting the market's expectations of where rates will be at specified future dates.
[18] Monetary tightening — A central bank policy of raising interest rates or reducing monetary accommodation to restrain inflation or cool an overheating economy.
[19] Neutral rate of interest — neutral rate of interest (r-star) — The theoretical level of the real interest rate at which monetary policy is neither expansionary nor contractionary, consistent with full employment and stable inflation.
[20] Peak yield — The highest yield reached within a given interest rate cycle, after which yields typically decline.
[21] Policy rates — policy interest rates — Interest rates set by a central bank to influence monetary conditions, including the federal funds rate and related administered rates.
[22] Quantitative Tightening — QT — The reduction of a central bank's balance sheet through letting securities mature without reinvestment or by actively selling holdings.
[23] Real yields — Bond yields adjusted for expected inflation, representing the actual purchasing-power return to the investor.
[24] Reverse Repo Facility — Reverse Repo Facility (RRP) — A Federal Reserve facility that allows eligible counterparties to lend cash to the Fed on an overnight basis in exchange for Treasury securities, draining excess reserves from the system.
[25] Sovereign debt — Debt securities issued and backed by a national government, considered among the lowest-credit-risk instruments.
[26] Summary of Economic Projections — Summary of Economic Projections (SEP) — A quarterly Federal Reserve publication containing FOMC members' forecasts for key macroeconomic variables including the federal funds rate, inflation, and unemployment.
[27] Term premium — The additional yield investors require to hold longer-maturity bonds instead of rolling over shorter-maturity instruments, compensating for interest rate and other risks.
[28] Term structure — term structure of interest rates — The relationship between interest rates (or yields) and maturities for comparable debt securities at a given point in time.
[29] Terminal rate — terminal federal funds rate — The peak level that the policy interest rate is expected to reach at the end of a tightening cycle before the central bank begins cutting.
[30] Treasury auctions — U.S. Treasury auctions — Competitive and non-competitive sales of new U.S. government debt securities conducted by the Treasury to finance federal borrowing.
[31] Treasury curve — U.S. Treasury yield curve — A yield curve specifically for U.S. Treasury securities, plotting yields against maturities and serving as a benchmark for other interest rates.
[32] Yield curve — A graphical representation of interest rates across different maturities for bonds of similar credit quality, used to assess expectations of future rates and economic conditions.
[33] Yield curve flattening — A reduction in the spread between long- and short-term yields, often signaling expectations of slowing growth or approaching rate cuts.
[34] Yield curve inversion — A condition in which short-term bond yields exceed long-term yields, historically considered a leading indicator of recession.
The following financial data tables were referenced during the debate exchanges:
| Date | 10‑Year Yield |
|---|---|
| 2024‑02‑01 | 4.78 % |
| 2024‑06‑01 | 4.12 % |
| 2024‑09‑01 | 3.90 % |
Legend: Daily closing yields for the U.S. 10‑year Treasury (source: Federal Reserve Economic Data, 2024).
| Period | 5‑Year Breakeven Inflation |
|---|---|
| Jan 2024 | 3.2 % |
| Sep 2024 | 2.4 % |
Legend: 5‑year breakeven inflation rates (source: U.S. Treasury, 2024).
| Contract | Yield |
|---|---|
| Dec 2025 Futures | 3.55 % |
| Dec 2026 Futures | 3.45 % |
Legend: CME 10‑year Treasury futures prices (source: CME Group, 2024).
| Series | Current 10Y yield | Implied Dec 2026 10Y yield | Difference |
|---|---|---|---|
| Treasury term structure point | 4.3% | 4.8% | +0.5 pp |
Legend: Market-implied comparison used in the target argument; percentages are yield levels, and the difference is in percentage points.
| Indicator | Current Level | Implied Peak Timing | Threshold |
|---|---|---|---|
| 10-Yr Yield | 4.35% | Q3 2026 | <5.50% |
| Fed Funds Rate | 4.25-4.50% | Holding | Restrictive |
| Debt/GDP | 123% | Rising | Fiscal Ceiling |
| Net Spec Shorts | Record | Contrarian Peak | Mean-Reversion |
| Implied Vol (MOVE) | Elevated | Spike = Peak | De-risking Trigger |
Legend: Market indicators supporting the claim that 10-year yield peaks before November 2026. Yields in %, debt/GDP ratio from Q2 2025 data. Speculator positioning from CFTC Commitment of Traders reports. Source: Federal Reserve, Treasury Department, CME Group.
Face-off transcripts
- ■
Ownership & Trade Secrets. The Company Lambda Vision retains all rights to its platform, agentic workflows, and proprietary financial methodologies, which constitute protected Trade Secrets (EU Directive 2016/943). Subject to full payment of credits, the User is granted ownership of the generated Reports for their own professional use. Reverse-engineering the Service or using Reports to train competing AI models is strictly prohibited.
- ■
No Financial Advice. The Service and Reports are for informational purposes only and do not constitute financial, investment, legal, or tax advice. The Company is not a regulated financial advisor. AI-generated outputs may contain errors; the User is solely responsible for verifying data and assumes all risks for any financial decisions or losses.
- ■
Liability & Governing Law. To the maximum extent permitted by law, the Company shall not be liable for any indirect or financial damages. These Terms are governed by French law. Any disputes shall be subject to the exclusive jurisdiction of the Courts of Paris, France.