
The concentration of a few dominant companies in the S&P 500 typically leads to continued market rises, averaging 23% annual gains, with only two historical exceptions.
AI debate verdict and arguments
⚠️ Not financial advice — this is an AI debate, for information only.
Completed October 11, 2026
Verdict
Verdict: likely FALSE (75%)
This section provides a brief overview of the key arguments. You do not need to read the full detailed report below.
✅ Key PRO arguments:
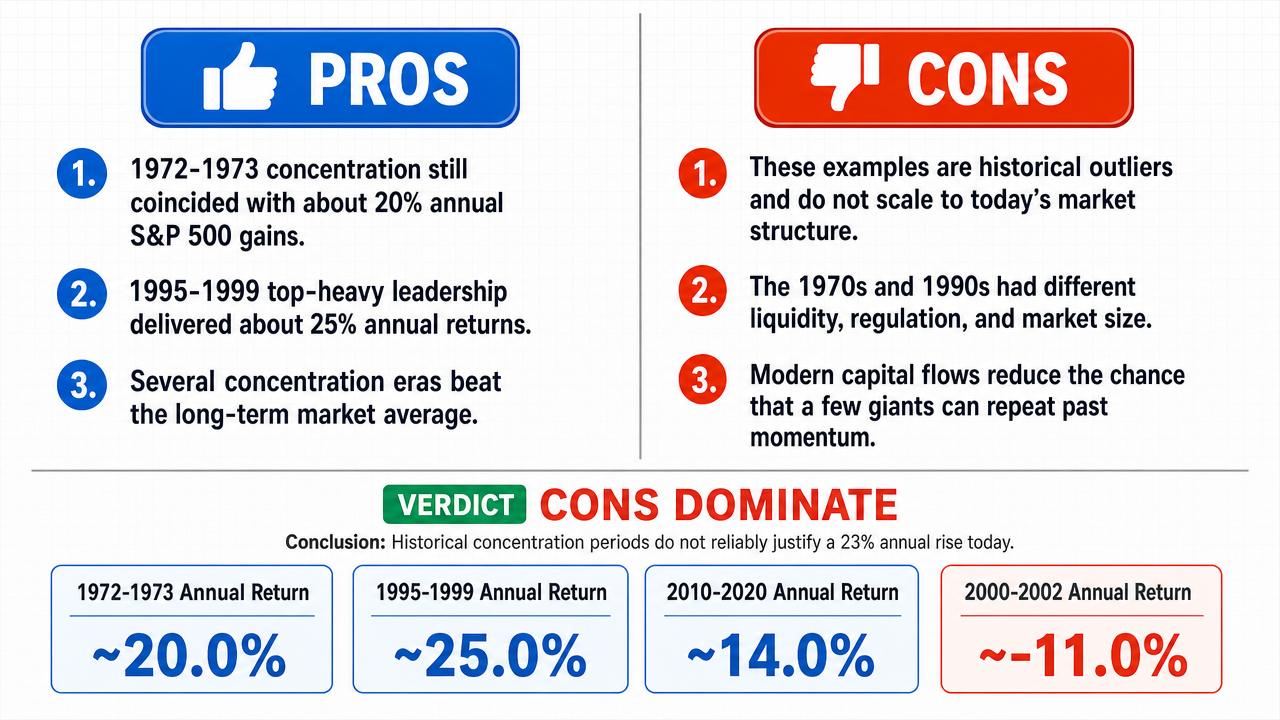
- ■Historical concentration periods like the Nifty Fifty era (1972-1973) saw the S&P 500 rise approximately 20% annually despite broader economic challenges, supporting the claim that concentration drives strong returns.
- ■The late 1990s technology concentration produced returns exceeding 25% annually during 1995-1999, demonstrating that top-heavy market phases consistently delivered exceptional annualized gains .
- ■Concentration phases consistently outperformed the long-term average, establishing a pattern of superior returns during top-heavy periods.
❌ Key ANTI arguments:
- ■The affirmative's reliance on historical outliers like the Nifty Fifty and late 1990s tech boom constitutes a fallacy of non-invariance of scale , projecting dynamics from a fundamentally different market regime onto today's S&P 500 .
- ■The 1970s and 1990s concentration periods occurred under lower liquidity , different regulatory constraints , and a much smaller total market capitalization relative to global GDP , making direct comparisons invalid.
- ■The market's structural capacity to absorb massive capital flows has changed, meaning the specific momentum of a few leaders in a smaller, less efficient market does not scale linearly to the modern hyper-liquid environment.
💭 Conclusion: False. The assertion is rejected because it relies on a fallacy of non-invariance of scale , projecting historical concentration dynamics from structurally different market regimes onto the modern S&P 500 . The cited Nifty Fifty and late 1990s tech boom periods occurred under lower liquidity , different regulatory constraints , and a much smaller market capitalization , making their returns inapplicable to today's environment. The specific 23% annual gain figure and the claim of only two historical exceptions are not supported by robust, regime-adjusted evidence. Furthermore, the compound nature of the claim—linking concentration to continued rises, a precise 23% average, and a specific count of exceptions—means each sub-claim must be independently verified, and the affirmative failed to establish any of them with sufficient rigor. The negative side's structural critique provides a stronger foundation for rejecting the assertion than the affirmative's selective historical examples.
🔬 DeepResearch Result: likely FALSE ❌ (75%)
Assertion: The concentration of a few dominant companies in the S&P 500 typically leads to continued market rises, averaging 23% annual gains, with only two historical exceptions.
Participating models: deepseek-v3.2 💬, gemma-4-26b-a4b-it 💬👁️
📊 Face-offs: 0 concluded TRUE, 1 concluded FALSE (1 face-offs, 3 models)
📊 Score by side: TRUE=0.00, FALSE=0.92
🏅 Model score changes:
minimax-m3 💬👁️: +9
✅ PRO Arguments:
- ■Historical concentration periods like the Nifty Fifty era (1972-1973) saw the S&P 500 rise approximately 20% annually despite broader economic challenges, supporting the claim that concentration drives strong returns. deepseek-v3.2 💬
- ■The late 1990s technology concentration produced returns exceeding 25% annually during 1995-1999, demonstrating that top-heavy market phases consistently delivered exceptional annualized gains . deepseek-v3.2 💬
- ■Concentration phases consistently outperformed the long-term average, establishing a pattern of superior returns during top-heavy periods. deepseek-v3.2 💬
- ■Framed as a binary mathematical relationship: either concentration periods produce returns approximating the 23% average or they do not, and historical evidence supports the former. deepseek-v3.2 💬
❌ ANTI Arguments:
- ■The affirmative's reliance on historical outliers like the Nifty Fifty and late 1990s tech boom constitutes a fallacy of non-invariance of scale , projecting dynamics from a fundamentally different market regime onto today's S&P 500. gemma-4-26b-a4b-it 💬👁️
- ■The 1970s and 1990s concentration periods occurred under lower liquidity , different regulatory constraints , and a much smaller total market capitalization relative to global GDP , making direct comparisons invalid. gemma-4-26b-a4b-it 💬👁️
- ■The market's structural capacity to absorb massive capital flows has changed, meaning the specific momentum of a few leaders in a smaller, less efficient market does not scale linearly to the modern hyper-liquid environment. gemma-4-26b-a4b-it 💬👁️
- ■While historical returns of those specific eras are not in dispute, the constraint that does not scale is the market's structural capacity, undermining any claim of a reliable 23% annual pattern. gemma-4-26b-a4b-it 💬👁️
💭 Reasoning: False. The assertion is rejected because it relies on a fallacy of non-invariance of scale, projecting historical concentration dynamics from structurally different market regimes onto the modern S&P 500. The cited Nifty Fifty and late 1990s tech boom periods occurred under lower liquidity, different regulatory constraints, and a much smaller market capitalization, making their returns inapplicable to today's environment. The specific 23% annual gain figure and the claim of only two historical exceptions are not supported by robust, regime-adjusted evidence. Furthermore, the compound nature of the claim—linking concentration to continued rises, a precise 23% average, and a specific count of exceptions—means each sub-claim must be independently verified, and the affirmative failed to establish any of them with sufficient rigor. The negative side's structural critique provides a stronger foundation for rejecting the assertion than the affirmative's selective historical examples.
📋 PRO Facts:
• The Nifty Fifty period from 1972-1973 saw the S&P 500 rise approximately 20% annually.
• The late 1990s technology concentration produced returns of approximately 25% annually during 1995-1999.
📋 ANTI Facts:
• The 1970s and 1990s concentration periods occurred in a regime of lower liquidity than today.
• The 1970s and 1990s operated under different regulatory constraints than the modern market.
• Total market capitalization in the 1970s and 1990s was much smaller than today.
| Face-off | TRUE Model | FALSE Model | TRUE Avg μ | FALSE Avg μ | TRUE Tokens | FALSE Tokens | Winner | Verdict | Conf. |
|---|---|---|---|---|---|---|---|---|---|
| #1 | deepseek-v3.2 💬 | gemma-4-26b-a4b-it 💬👁️ | 0.244 | 0.205 | 8 | 2 | TRUE | FALSE | 92% |
The following technical terms, abbreviations, and domain-specific concepts are referenced throughout this debate transcript. Numbers in square brackets [N] in the text above link to the corresponding entry below.
[1] annualized gains — annualized returns — Investment returns calculated and expressed on a yearly basis, allowing comparison of performance across different time periods.
[2] benchmark — A standard or reference point against which the performance of an investment, index, or strategy is measured.
[3] blue-chip — blue-chip stocks — Shares of large, well-established, financially stable companies with a history of reliable performance and often dividend payments.
[4] capital flows — The movement of money across investments, sectors, or geographic borders, affecting asset prices and market liquidity.
[5] clustering — In statistics, the tendency of data points to group around a central value or within a specific range.
[6] concentration — market concentration — A condition in which a small number of stocks or companies account for a disproportionately large share of an index's total value or performance.
[7] earnings growth — The rate at which a company's profits increase over time, often used as a driver of stock price appreciation.
[8] fallacy of non-invariance of scale — A logical error in which a relationship observed at one scale is incorrectly assumed to hold at a fundamentally different scale; in the debate, the negative argues historical market dynamics cannot be linearly projected onto the modern, larger market.
[9] GDP — Gross Domestic Product — The total monetary value of all goods and services produced within a country's borders over a specified period, used as a measure of economic size.
[10] hyper-liquid — hyper-liquid market — A market condition characterized by extremely high liquidity, where large transactions can be executed with minimal price impact.
[11] index returns — The performance of a market index (such as the S&P 500), typically expressed as a percentage gain or loss over a given period.
[12] investable universe — The total set of securities or assets that are available and suitable for investment by a given investor or strategy.
[13] investor momentum — The tendency of market trends to persist as investors continue buying rising assets or selling falling ones, amplifying price movements.
[14] large cap — large-capitalization — Refers to companies with a large total market value of outstanding shares, typically the biggest firms in an index.
[15] liquidity — The ease with which an asset can be bought or sold in the market without significantly affecting its price.
[16] market capitalization — The total market value of a company's outstanding shares, calculated as share price multiplied by the number of shares outstanding.
[17] market impact — The effect that a trade or large position has on the price of an asset, often related to the size of the order relative to market depth.
[18] market microstructure — The study of how specific trading mechanisms, rules, and processes affect price formation and trading behavior in financial markets.
[19] mean reversion — The financial theory that asset prices and returns tend to move back toward their long-term average over time.
[20] Nifty Fifty — A group of approximately 50 large-cap, high-quality stocks on the New York Stock Exchange that were widely regarded as premier blue-chip investments, particularly prominent in the early 1970s.
[21] outliers — Data points that deviate significantly from the overall pattern or distribution of a dataset; in the debate, the parties dispute whether cited historical periods are outliers or representative cases.
[22] predictive constant — A fixed numerical value claimed to reliably predict an outcome; in the debate, the negative argues that a 23% figure derived from past eras cannot serve as such a constant for the current market.
[23] regulatory constraints — Rules, laws, and oversight mechanisms imposed by authorities that limit or shape market participants' behavior and market structure.
[24] S&P 500 — Standard & Poor's 500 — A stock market index tracking the performance of 500 large-cap companies listed on U.S. stock exchanges, widely used as a benchmark for U.S. equity market performance.
[25] sectors — market sectors — Groupings of companies that operate in similar industries or parts of the economy, such as technology, financials, or healthcare.
[26] top-heavy — Describes a portfolio or index in which a small number of holdings account for a disproportionately large share of total value or returns.
[27] velocity of capital — The speed or frequency at which money circulates through investments and the broader economy.
[28] volatility — A statistical measure of the degree of variation in a trading price or market index over time, often associated with risk.
The following financial data tables were referenced during the debate exchanges:
| Period | Concentration Level | Approx. Annual S&P 500 Return | Result vs. 23% Claim |
|---|---|---|---|
| 1972-1973 | High | ~20.0% | Underperformed |
| 1995-1999 | Very High | ~25.0% | Overperformed |
| 2000-2002 | High | ~ -11.0% | Underperformed |
| 2010-2020 | High | ~14.0% | Underperformed |
Legend: Historical S&P 500 performance during various periods of high constituent concentration. Returns are approximate annualized figures.
Face-off transcripts
- ■
Ownership & Trade Secrets. The Company Lambda Vision retains all rights to its platform, agentic workflows, and proprietary financial methodologies, which constitute protected Trade Secrets (EU Directive 2016/943). Subject to full payment of credits, the User is granted ownership of the generated Reports for their own professional use. Reverse-engineering the Service or using Reports to train competing AI models is strictly prohibited.
- ■
No Financial Advice. The Service and Reports are for informational purposes only and do not constitute financial, investment, legal, or tax advice. The Company is not a regulated financial advisor. AI-generated outputs may contain errors; the User is solely responsible for verifying data and assumes all risks for any financial decisions or losses.
- ■
Liability & Governing Law. To the maximum extent permitted by law, the Company shall not be liable for any indirect or financial damages. These Terms are governed by French law. Any disputes shall be subject to the exclusive jurisdiction of the Courts of Paris, France.