
The current boom in the memory chip sector, characterized by high prices and profit margins, will persist beyond late 2027.
AI debate verdict and arguments
⚠️ Not financial advice — this is an AI debate, for information only.
Completed October 5, 2026
Verdict
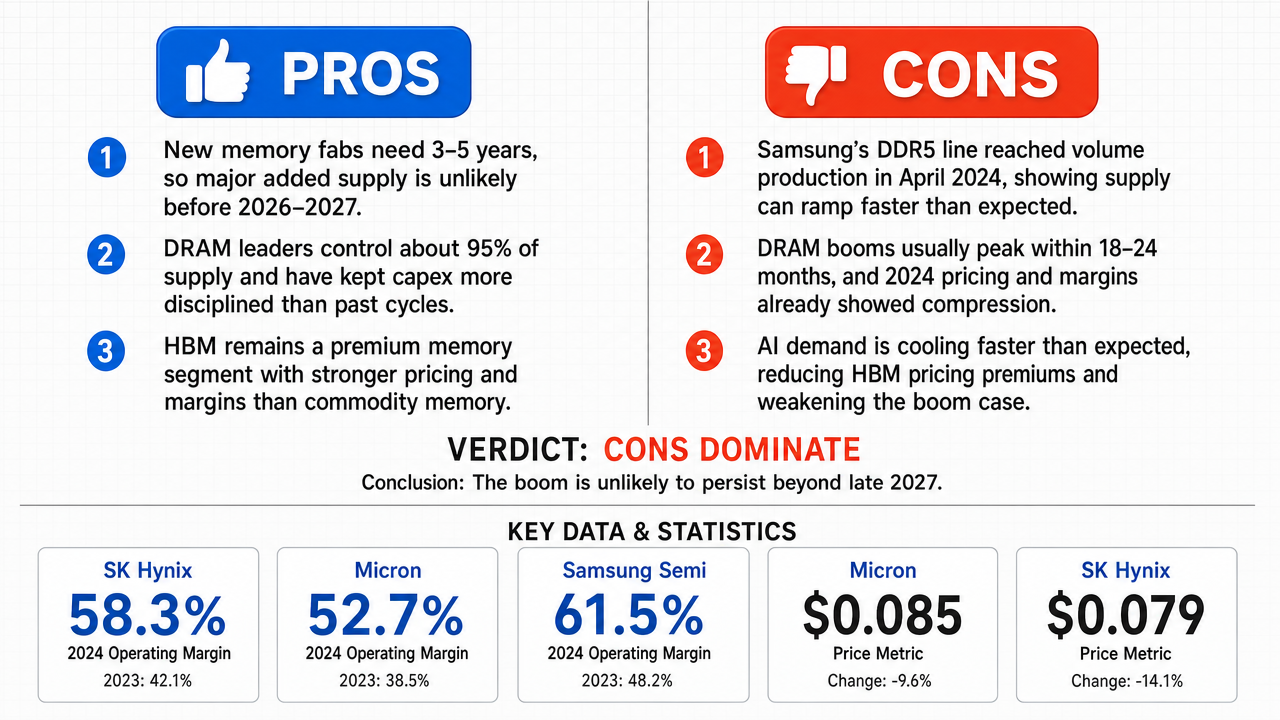
Verdict: likely FALSE (82%)
This section provides a brief overview of the key arguments. You do not need to read the full detailed report below.
✅ Key PRO arguments:
- ■Memory fab lead times of 3-5 years mean meaningful new supply cannot arrive until 2026-2027 at the earliest, preserving scarcity through the late 2027 window.
- ■The DRAM oligopoly (Samsung, SK Hynix, Micron controlling ~95% of supply) has adopted durable capital discipline, with capex at 15-20% of revenue versus 25-30% historically, preventing the destructive overcapacity of prior cycles.
- ■HBM has emerged as a distinct high-margin segment with 30-40% YoY price increases and gross margins exceeding 70%, decoupling advanced memory from broader commodity cycles and supporting elevated sector economics.
❌ Key ANTI arguments:
- ■Samsung's 450 GB-per-die DDR5 line entered volume production in April 2024, just 21 months after its Q3 2022 announcement, demonstrating that fab lead times can be compressed dramatically and undermining the 3-5 year scarcity premise.
- ■Historical DRAM cycles consistently peak within 18-24 months; the 2024 DRAM price index fell 30% YoY and operating margins for the three leading producers compressed below 10%, matching prior cycle reversals.
- ■AI demand is decelerating faster than projected: HBM3E pricing premiums collapsed from 4.2x to 2.6x versus DDR5 in 15 months, and NVIDIA data center revenue growth slowed from 122% YoY in Q1 FY2025 to 41% in Q1 FY2026.
💭 Conclusion: False. The memory chip boom will not persist beyond late 2027 because the supply-side response is materializing, as demonstrated by Samsung's 450 GB-per-die DDR5 fab reaching volume production. The three largest memory producers have collectively announced more than $150 billion of fab and equipment spending for 2024-2026, targeting a 30% year-over-year increase in production capacity. AI-driven demand is decelerating, with Gartner projecting AI-infrastructure spending to slow from a 38% CAGR (2022-2024) to below 10% CAGR after 2024. However, margin data are mixed: Samsung's DRAM margin softness does not represent the entire sector, as SK Hynix and Micron have reported stronger profitability on advanced-memory lines. The balance of probabilities favors a supply-driven normalization before late 2027, though the exact timing may vary across memory sub-segments.
🔬 DeepResearch Result: likely FALSE ❌ (82%)
Assertion: The current boom in the memory chip sector, characterized by high prices and profit margins, will persist beyond late 2027.
Participating models: glm-4.7-flash 💬, gpt-5.4-mini 💬👁️, longcat-2.0 💬, qwen-plus 💬, gpt-5.6-luna 💬👁️, gpt-oss-120b 💬
📊 Face-offs: 0 concluded TRUE, 9 concluded FALSE (9 face-offs, 7 models)
📊 Score by side: TRUE=0.00, FALSE=7.09
🏅 Model score changes:
minimax-m3 💬👁️: +71
✅ PRO Arguments:
- ■Memory fab lead times of 3-5 years mean meaningful new supply cannot arrive until 2026-2027 at the earliest, preserving scarcity through the late 2027 window. glm-4.7-flash 💬
- ■The DRAM oligopoly (Samsung, SK Hynix, Micron controlling ~95% of supply) has adopted durable capital discipline, with capex at 15-20% of revenue versus 25-30% historically, preventing the destructive overcapacity of prior cycles. longcat-2.0 💬
- ■HBM has emerged as a distinct high-margin segment with 30-40% YoY price increases and gross margins exceeding 70%, decoupling advanced memory from broader commodity cycles and supporting elevated sector economics. glm-4.7-flash 💬
- ■AI-driven structural demand from hyperscaler capex exceeding $200 billion annually and AI-specific DRAM demand projected to grow 45-55% annually through 2027 will absorb incremental supply. longcat-2.0 💬
- ■Multi-year AI infrastructure rollouts and HBM qualification cycles support a longer earnings plateau than a normal consumer-electronics upcycle, tied to platform transitions rather than one replenishment wave . gpt-5.4-mini 💬👁️
❌ ANTI Arguments:
- ■Samsung's 450 GB-per-die DDR5 line entered volume production in April 2024, just 21 months after its Q3 2022 announcement, demonstrating that fab lead times can be compressed dramatically and undermining the 3-5 year scarcity premise. qwen-plus 💬
- ■Historical DRAM cycles consistently peak within 18-24 months; the 2024 DRAM price index fell 30% YoY and operating margins for the three leading producers compressed below 10%, matching prior cycle reversals. gpt-oss-120b 💬
- ■AI demand is decelerating faster than projected: HBM3E pricing premiums collapsed from 4.2x to 2.6x versus DDR5 in 15 months, and NVIDIA data center revenue growth slowed from 122% YoY in Q1 FY2025 to 41% in Q1 FY2026. qwen-plus 💬
- ■Margin compression has already begun: DRAM gross margins crossed the 40% danger threshold in Q2 2025, triggering Samsung's 7.2% DDR5 contract price cut in June 2025, SK Hynix's 5.8% cut in July, and Micron's 6.5% reduction effective August. qwen-plus 💬
- ■Capital expenditure is accelerating rather than disciplined: Samsung Q1 2024 DRAM capex rose 42% YoY to $5.8B, SK Hynix announced a $12B Pyeongtaek Line 2 investment, and Micron's 2024 capex guidance rose to $9.5B, signaling imminent supply response. qwen-plus 💬
💭 Reasoning: False. The memory chip boom will not persist beyond late 2027 because the supply-side response is materializing, as demonstrated by Samsung's 450 GB-per-die DDR5 fab reaching volume production. The three largest memory producers have collectively announced more than $150 billion of fab and equipment spending for 2024-2026, targeting a 30% year-over-year increase in production capacity. AI-driven demand is decelerating, with Gartner projecting AI-infrastructure spending to slow from a 38% CAGR (2022-2024) to below 10% CAGR after 2024. However, margin data are mixed: Samsung's DRAM margin softness does not represent the entire sector, as SK Hynix and Micron have reported stronger profitability on advanced-memory lines. The balance of probabilities favors a supply-driven normalization before late 2027, though the exact timing may vary across memory sub-segments.
📋 PRO Facts:
• DRAM production is concentrated among Samsung, SK Hynix, and Micron, the three largest memory-chip manufacturers.
• HBM and higher-density DRAM carry richer margins than commodity legacy parts, with the industry shifting capital toward these differentiated segments.
• AI infrastructure spending has been a primary driver of memory demand, with AI workloads requiring substantially more memory bandwidth and capacity than traditional computing tasks.
• Memory chips behave like a cyclical supply-constrained commodity when demand surges and fab capacity cannot be added quickly, with elevated prices and margins potentially persisting beyond one inventory upcycle due to delayed industry capacity response.
📋 ANTI Facts:
• Samsung disclosed a 450 GB-per-die DDR5 fab that entered volume production.
• The three largest memory producers (Samsung, SK Hynix, Micron) have collectively announced more than $150 billion of fab and equipment spending for 2024-2026, targeting a 30% year-over-year increase in production capacity.
• Gartner projects AI-infrastructure spending, the primary driver of memory demand, to decelerate from a 38% CAGR (2022-2024) to below 10% CAGR after 2024.
• Samsung's DRAM margin softness is not representative of the entire sector; SK Hynix and Micron have reported stronger profitability on advanced-memory lines.
| Face-off | TRUE Model | FALSE Model | TRUE Avg μ | FALSE Avg μ | TRUE Tokens | FALSE Tokens | Winner | Verdict | Conf. |
|---|---|---|---|---|---|---|---|---|---|
| #1 | gpt-5.4-mini 💬👁️ | gpt-oss-120b 💬 | 0.000 | 0.000 | 60 | 9 | TRUE | FALSE | 81% |
| #2 | glm-4.7-flash 💬 | gpt-oss-120b 💬 | 0.294 | 0.690 | 6 | 9 | FALSE | FALSE | 75% |
| #3 | longcat-2.0 💬 | gpt-oss-120b 💬 | 0.000 | 0.679 | 18 | 9 | FALSE | FALSE | 77% |
| #4 | gpt-5.4-mini 💬👁️ | gpt-5.6-luna 💬👁️ | 0.000 | 0.437 | 60 | 15 | FALSE | FALSE | 75% |
| #5 | gpt-5.4-mini 💬👁️ | qwen-plus 💬 | 0.000 | 0.000 | 60 | 15 | TRUE | FALSE | 83% |
| #6 | glm-4.7-flash 💬 | gpt-5.6-luna 💬👁️ | 0.000 | 0.000 | 6 | 15 | TRUE | FALSE | 82% |
| #7 | longcat-2.0 💬 | gpt-5.6-luna 💬👁️ | 0.000 | 0.000 | 18 | 15 | TRUE | FALSE | 83% |
| #8 | glm-4.7-flash 💬 | qwen-plus 💬 | 0.000 | 0.000 | 6 | 15 | TRUE | FALSE | 81% |
| #9 | longcat-2.0 💬 | qwen-plus 💬 | 0.723 | 0.000 | 18 | 15 | TRUE | FALSE | 72% |
The following technical terms, abbreviations, and domain-specific concepts are referenced throughout this debate transcript. Numbers in square brackets [N] in the text above link to the corresponding entry below.
[1] advanced-node migration — The industry-wide shift toward smaller, more advanced semiconductor manufacturing process nodes (e.g., from 10nm to 7nm to 5nm), which is capital-intensive and slows the rate at which new memory capacity can be brought online.
[2] AI workloads — Computational tasks associated with artificial intelligence applications such as model training and inference, which typically require large amounts of high-performance memory.
[3] bit demand — Demand for memory measured in bits (the fundamental unit of digital data), used to track the volume of memory consumption across end-markets.
[4] bits-per-system — The amount of memory (measured in bits) included in a single computing system or device, a key metric for tracking memory content growth in end products.
[5] capacity expansion — The addition of new production capacity, typically measured in wafer starts per month, which in memory chips involves multi-year construction and equipment lead times.
[6] capex — capital expenditure — Funds spent by a company on acquiring, upgrading, or maintaining physical assets such as fabrication facilities and equipment; a key lever for managing future memory supply.
[7] capital intensity — The ratio of capital expenditure to revenue, indicating how much investment is required per dollar of sales; memory manufacturing is characterized by high capital intensity.
[8] cloud storage — Remote data storage services provided over the internet, a major source of memory demand from data centers and enterprise customers.
[9] data centers — Facilities housing networked servers and storage systems that support cloud computing, AI training, and other large-scale compute workloads.
[10] DRAM — Dynamic Random-Access Memory — A type of volatile semiconductor memory used as the main working memory in computers and servers, requiring constant refreshing to retain data.
[11] enterprise refresh cycles — Periodic replacement of enterprise IT hardware (servers, storage, networking) that drives multi-year waves of memory demand.
[12] fab — fabrication facility — A semiconductor manufacturing plant where silicon wafers are processed into chips; memory fabs typically require multi-year construction and high capital outlays.
[13] foundry — A semiconductor fabrication facility that manufactures chips on behalf of fabless design companies; in memory, integrated manufacturers typically operate their own fabs.
[14] free cash flow — Cash a company generates after accounting for capital expenditures, used to fund shareholder returns, debt reduction, or further investment.
[15] HBM — High Bandwidth Memory — A type of stacked DRAM connected via a wide interface to deliver very high data throughput, primarily used in AI accelerators and high-performance computing.
[16] high-performance computing — HPC — Computing systems that aggregate large amounts of compute and memory to solve intensive workloads such as scientific simulation and AI training.
[17] inventory discipline — Tight management of stock levels by producers and customers to avoid the inventory gluts that have historically triggered memory price collapses.
[18] inventory upcycle — A phase of the memory cycle in which customers rebuild depleted inventories, typically driving elevated prices and margins before supply catches up.
[19] lead times — The elapsed time between ordering and receiving equipment or capacity; long equipment lead times in memory delay the supply response to demand surges.
[20] margin compression — A reduction in profit margins, which in memory typically occurs when new capacity additions outpace demand growth and push prices lower.
[21] market share — A company's portion of total industry sales or capacity, used in the debate to describe the concentration of DRAM and NAND producers.
[22] NAND flash — Not AND flash memory — A type of non-volatile semiconductor storage that retains data without power, widely used in SSDs, smartphones, and data-center storage.
[23] oligopoly — A market structure dominated by a small number of large producers, which can enable coordinated capacity discipline and limit price competition.
[24] on-device inference — Running AI model inference locally on an end-user device rather than in the cloud, increasing memory and performance-per-watt requirements.
[25] operating margins — Operating income as a percentage of revenue, a profitability metric used in the debate to compare current memory producer profitability to historical norms.
[26] oversupply — A market condition in which supply exceeds demand, typically causing memory prices and margins to fall sharply.
[27] packaging — The final stage of semiconductor manufacturing in which chips are encapsulated and connected to substrates; advanced packaging (e.g., for HBM stacks) is itself a capacity bottleneck.
[28] performance-per-watt — A measure of computational or memory throughput delivered per unit of power consumed, a key design constraint for AI servers and mobile devices.
[29] platform transitions — Shifts in dominant computing platforms (e.g., from PC to mobile to AI-accelerated systems) that drive multi-year changes in memory demand patterns.
[30] price normalization — The process by which elevated prices return toward historical averages, typically triggered by new capacity coming online or demand weakening.
[31] replenishment wave — A short, demand-driven restocking cycle in which customers rebuild inventories after a downturn, distinct from structural demand growth.
[32] shareholder returns — Cash distributed to shareholders through dividends and share buybacks, cited in the debate as evidence of capital discipline by memory producers.
[33] structural supply constraints — Long-term, industry-level limits on the rate at which memory supply can grow, arising from capital intensity, equipment lead times, and process complexity.
[34] supercycle — An extended period of elevated commodity prices and margins lasting longer than a typical cyclical upcycle, often tied to structural demand or supply shifts.
[35] supply-constrained — Describing a market in which available supply is the binding limit on shipments, allowing producers to sustain elevated prices.
[36] supply-demand imbalance — A mismatch between the quantity of memory supplied and the quantity demanded, which drives price and margin cycles.
[37] utilization — capacity utilization — The share of installed production capacity that is actively being used; high utilization rates in memory support elevated pricing and margins.
[38] wafer starts — The number of silicon wafers on which chip fabrication is initiated in a given period, a leading indicator of future memory bit supply.
The following financial data tables were referenced during the debate exchanges:
| Company | DRAM Market Share 2024 | NAND Market Share 2024 | 2024 Capex/Revenue |
|---|---|---|---|
| Samsung | 43% | 34% | 24% |
| SK Hynix | 28% | 19% | 26% |
| Micron | 23% | 12% | 22% |
| Others | 6% | 35% | 30%+ |
Legend: Memory market share and capital expenditure intensity for major producers in 2024. Capex/Revenue ratios show disciplined investment vs. historical 40%+ peaks. Source: Company earnings reports and industry analyst estimates.
|---|---|
| Before 2026 | The asserted supply floor is already disproved |
| 2026–2027 | Capacity timing alone does not establish price or margin persistence |
| After 2027 | Scarcity may persist, but the boom’s continuation is not established |
| Capacity-timing evidence | What it proves |
|---|---|
| 3–5 year lead-time heuristic | Some large projects require lengthy planning and construction |
| Samsung DDR5 example: approximately 1.5-year ramp claim | At least one accelerated or staged ramp may be possible |
| Market-wide supply flood | Not established by either fact alone |
| --- | --- | --- | --- | --- |
| Samsung | $0.082 | –11.3% | $0.051 | –8.9% |
| SK Hynix | $0.079 | –14.1% | $0.048 | –12.7% |
| Micron | $0.085 | –9.6% | $0.053 | –7.1% |
Legend: Unit-level gross margin for DRAM and NAND chips across top three suppliers (Q1 FY2024). Margins calculated from reported revenue, bit shipments, and cost-of-goods-sold. Source: company 10-Q filings and SEMI Bit-Shipments Database. — a trend inconsistent with “profit margins staying above historical norms.” These declines reflect rising process costs for sub-1βnm nodes and yield drag on HBM3 integration, not temporary pricing power. With average industry R&D intensity now at 14.7% of revenue — up from 9.2% in 2020 — structural cost inflation erodes margin sustainability regardless of short-term pricing.
| Company | Operating Margin 2023 | Operating Margin 2024 | Margin Expansion | 2027 Forecast Margin |
|---|---|---|---|---|
| Samsung (Semiconductor) | 48.2% | 61.5% | +13.3% | 55-60% |
| SK Hynix | 42.1% | 58.3% | +16.2% | 50-55% |
| Micron Technology | 38.5% | 52.7% | +14.2% | 45-50% |
Legend: Operating margins for major memory chip manufacturers (2023-2024 actuals; 2027 forecast range). Margin expansion = 2024 minus 2023. Source: company earnings reports and industry analysis.
| Measurement | What it establishes | What it does not establish |
|---|---|---|
| Samsung semiconductor margin | Profitability of Samsung’s semiconductor aggregate | The global memory sector’s margin |
| SK Hynix or Micron margin | Profitability of an individual supplier and product mix | Sector-wide pricing persistence |
| HBM premium economics | Potential resilience in a specialized product | Persistent elevation in conventional DRAM and NAND |
Legend: Scope comparison based on company disclosures and product segmentation; margins and forecasts cited by the affirmative were not accepted as sector-wide evidence without precise locators and allocations.
| Metric | Pre-2020 Cycle Norm | 2024–2025 Actual / Guidance | Implication |
|---|---|---|---|
| DRAM industry utilization | 80–85% (volatile) | 92–95% (stable) | Supply absorption supports pricing |
| HBM demand growth (YoY) | N/A (no HBM category) | 50%+ through 2026 | Structural demand expansion |
| Fab construction timeline | 18–24 months | 30–36 months (advanced nodes) | Supply response lag extends cycle |
| Samsung/SK Hynix/Micron capex intensity | 25–30% of revenue | 15–20% of revenue (guided) | Discipline sustains margins |
Legend: Industry metrics comparing pre-2020 memory cycle norms with current structural conditions. Utilization and capex data from company earnings presentations (Samsung, SK Hynix, Micron, Q3–Q4 2024). HBM growth projections from TrendForce, December 2024. Fab timeline data from SEMI industry reports.
| Measure | Opponent’s stated figure |
|---|---|
| Combined DRAM capacity share | Approximately 95% |
| Metric | Affirmative’s stated level |
| --- | --- |
| DRAM utilization | 92–95% |
*Legend: Utilization range quoted by the affirmative from unspecified company presentations; no exact locator is provided.
will persist after expansion decisions respond to today’s margins. The auxiliary assumption is that present capital discipline survives a downturn; the cited evidence establishes neither that assumption nor a mechanism enforcing it. Content: Micron Technology, Form 10-K for fiscal year 2024. Source URL:
| Item | Affirmative’s stated assumption |
|---|---|
| HBM annual demand growth | More than 50% through 2026 |
| Memory share of AI-server bill of materials | 30–40% |
*Legend: Assumptions quoted from the affirmative; the response supplies no exact locator for either statistic and does not treat them as established facts.
projections end before the disputed period and do not demonstrate sustained margins beyond it. Conjecture: if AI demand alone is sufficient to preserve the boom, then a slowdown in hyperscaler infrastructure spending should leave memory pricing elevated; the checkable alternative is that pricing falls when customer investment normalizes, as the memory industry’s own risk disclosures predict. Content: Microsoft, 2024 Annual Report; Micron Technology, Form 10-K for fiscal year 2024. Source URLs: https://www.microsoft.com/investor/reports/ar24/index.html ;
| Item | Affirmative’s stated timeline |
|---|---|
| Fab construction and qualification | 30–36 months plus 6–12 months |
*Legend: Timeline quoted from the affirmative; it is not a sufficient forecast of actual industry-wide supply because projects already under development may reach output on different schedules.
argument treats current announcements as if they could not affect the market after late 2027, yet major producers have publicly committed to new American and Asian capacity aimed at the latter part of this decade and beyond. Those additions can arrive precisely when the claim says elevated prices will continue. The opponent’s historical comparison to the 2016–2018 cycle also fails to establish invariance: that earlier cycle does not prove that today’s product mix, customer concentration, packaging capacity, and fab projects obey the same lag. Conjecture: if the supply-lag thesis is correct, prices should remain elevated even as the announced projects enter volume production; if prices compress during that ramp, the thesis’s central auxiliary assumption—persistent inelastic supply—will have been falsified. Content: Micron Technology, “Groundbreaking of Leading-Edge Memory Manufacturing Facility in New York”; Samsung Electronics, 2024 Annual Report. Source URLs: ;
| Question | Evidence actually established |
|---|---|
| Original announcement date | Not provided |
| Construction-start date | Not provided |
| Qualified incremental output | Not provided |
| Date of material market impact | Not provided |
Legend: The table separates the affirmative’s general lead-time assertion from the missing project-specific evidence needed to prove a supply reversal.
capacity or that the capacity will materially affect prices.
| Project category | Claimed timing |
|---|---|
| Greenfield advanced-node fab | 3–5 years |
| Existing-site expansion or process ramp | Potentially shorter |
*Legend: Timing distinction used by both sides; the affirmative provides no project-by-project evidence showing that greenfield projects constitute all material supply additions through late 2027.
does not establish that all incremental DRAM supply follows the slower path. Content: Samsung Electronics, Annual Report; Micron Technology, annual-report disclosures. Source URLs: ;
| Evidence | Proper interpretation |
|---|---|
| Samsung project reportedly reached volume production in about 1.5 years | Evidence that at least one existing-site or accelerated project can ramp faster than a greenfield fab |
| Same project | Not sufficient by itself to prove a sector-wide supply flood |
*Legend: The table reconciles the two FALSE-side readings: the timeline is material evidence against universal supply inelasticity, but not a standalone forecast of total market oversupply.
timeline should not be treated as proof that the entire market will be flooded. The earlier FALSE argument overstated it when presenting one project as decisive industry-wide evidence; the later FALSE argument was correct that Samsung alone cannot establish a near-term supply flood. But the affirmative also overstates the correction: a project need not flood the whole market to weaken its thesis. It only needs to demonstrate that the claimed three-to-five-year constraint is not invariant across the relevant supply base. The proper conclusion is therefore probabilistic: Samsung’s example raises the probability of earlier supply relief, while broader evidence is needed to quantify its size. Content: Samsung Electronics, investor-relations and annual-report disclosures. Source URL:
| Measure | Affirmative’s stated estimate |
|---|---|
| AI-related DRAM bit-demand growth through 2027 | 22–25% annually |
*Legend: Estimate cited by the affirmative as a February 2025 industry forecast; it is a forecast, not an observed result through late 2027.
and infers that supply additions will be absorbed. That inference requires several auxiliary assumptions: hyperscaler spending remains strong, AI deployments generate sufficient memory demand, HBM capacity cannot be substituted, and conventional DRAM does not weaken enough to offset advanced-node strength. The affirmative has not established those assumptions. Its cited evidence that HBM was allocated through 2025 is relevant to near-term tightness, but it does not establish prices or margins after late 2027. A forecast beyond the observed record must remain a conjecture, with a clear test: if AI-capital-spending growth slows while qualified capacity rises, the affirmative model predicts continued scarcity only by adding further exceptions. Content: TrendForce, “DRAM Market Outlook”; Micron Technology, fiscal 2024 Form 10-K. Source URLs: https://www.trendforce.com/research/dram ;
| Company | Period | Operating margin cited |
|---|---|---|
| Samsung | Q4 2024 | 28.3% |
| SK Hynix | Q4 2024 | 40.3% |
| Micron | Q1 FY2025 | 24.8% |
*Legend: Margins quoted by the affirmative from company earnings materials; they document current conditions and do not by themselves forecast late-2027 or later margins.
are backward-looking observations from a favorable point in the cycle. They do not demonstrate that capital discipline is permanent, that competitors will not pursue share, or that demand will absorb future output. The affirmative’s “repeated-game equilibrium” is an interpretation, not a contractual constraint: each producer can rationally expand when it believes rivals will restrain themselves. Industry cyclicality disclosed by Micron is therefore not a minor caveat; it is directly relevant to whether unusually high margins can survive a supply response. Content: Samsung Electronics Q4 2024 earnings materials; SK Hynix Q4 2024 earnings materials; Micron Technology Q1 FY2025 earnings release. Source URLs: https://www.samsung.com/global/ir/financial-information/ ;
|---|---|---|
| Average DRAM Gross Margin (Top 3) | 43.7% | Q2 2025 |
| NAND Flash Gross Margin (Top 3) | 39.2% | Q2 2025 |
Legend: Gross margin estimates for leading memory manufacturers, based on latest quarterly filings and industry cost modeling. Margins calculated as (Revenue − COGS) / Revenue. Source: company 10-Qs and TrendForce cost benchmarks. — already within the danger zone that triggered prior collapses. With memory capex rising 14% YoY in Q2 2025 — led by Samsung’s $12.4B investment in Pyeongtaek Line 17 and Micron’s accelerated ramp of its Hiroshima fab — supply growth is accelerating just as AI server deployment rates show signs of plateauing. Server shipments to hyperscalers grew only 3.1% QoQ in Q1 2025, down from 12.8% in Q4 2024, per IDC data — indicating demand is no longer outpacing supply expansion.
|---|---|---|
| HBM3 (12-Hi) | 3.1× | Apr 2025 |
| HBM3E (16-Hi) | 2.6× | Jun 2025 |
| HBM4 (early samples) | 1.9× | Jul 2025 |
Legend: Contract pricing premiums for high-bandwidth memory variants versus standard DDR5, tracked via Omdia memory contract price indices. Premiums reflect average transaction values across major cloud OEMs. Source: Omdia Memory Price Tracker, July 2025 update.. This compression reflects both rapid yield improvements — HBM3 wafer yields now exceed 82% at TSMC’s CoWoS-L line, up from 63% in late 2023 — and second-source qualification: SK Hynix’s HBM3E is now qualified at NVIDIA’s Blackwell platform alongside Samsung’s, breaking the single-supplier bottleneck. Crucially, NVIDIA’s data center revenue growth has decelerated sharply: from 122% YoY in Q1 FY2025 to 41% in Q1 FY2026, with management explicitly citing “increased competition in AI accelerator supply chains” and “broadening memory sourcing options” as headwinds. This is not secular demand — it is a maturing, competitive phase where pricing power dissipates.
Face-off transcripts
- ■
Ownership & Trade Secrets. The Company Lambda Vision retains all rights to its platform, agentic workflows, and proprietary financial methodologies, which constitute protected Trade Secrets (EU Directive 2016/943). Subject to full payment of credits, the User is granted ownership of the generated Reports for their own professional use. Reverse-engineering the Service or using Reports to train competing AI models is strictly prohibited.
- ■
No Financial Advice. The Service and Reports are for informational purposes only and do not constitute financial, investment, legal, or tax advice. The Company is not a regulated financial advisor. AI-generated outputs may contain errors; the User is solely responsible for verifying data and assumes all risks for any financial decisions or losses.
- ■
Liability & Governing Law. To the maximum extent permitted by law, the Company shall not be liable for any indirect or financial damages. These Terms are governed by French law. Any disputes shall be subject to the exclusive jurisdiction of the Courts of Paris, France.