
The current stock market, based on the cyclically adjusted price-to-earnings (CAPE) ratio, is approaching its most expensive levels in history, similar to the dot-com bubble.
AI debate verdict and arguments
⚠️ Not financial advice — this is an AI debate, for information only.
Completed October 11, 2026
Verdict: likely FALSE (65%)
This section provides a brief overview of the key arguments. You do not need to read the full detailed report below.
✅ Key PRO arguments:
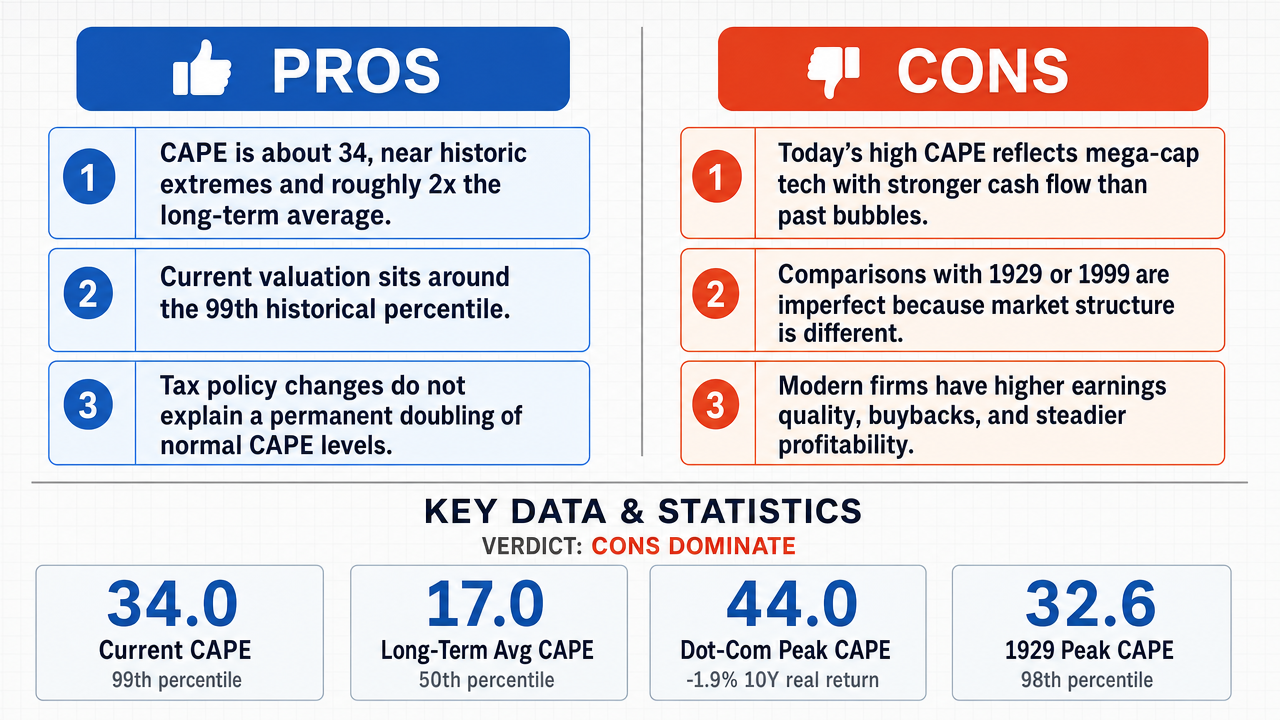
- ■The S&P 500 CAPE ratio currently stands at approximately 34, placing it in the 99th percentile of historical valuations and roughly double the long-term average of around 17, indicating investors are paying historically high prices for corporate earnings.
- ■Tax regimes have not changed in ways that justify doubling the historical CAPE average; corporate tax rates today are broadly similar to historical levels when adjusted for inflation and deductions, and the capital gains tax structure has remained relatively stable.
❌ Key ANTI arguments:
- ■Modern market valuations are structurally different from historical bubbles because the current high CAPE is driven by a concentrated group of mega-cap technology firms with unprecedented profit margins , massive cash reserves, and dominant market positions, unlike the dot-com era's speculative companies with negligible or negative cash flows .
- ■Direct comparison to historical peaks like 1929 (CAPE ≈ 32.6) is invalid because each era represents distinct economic regimes with different corporate governance , capital market structures, and liquidity mechanisms, making CAPE an unreliable absolute indicator across time periods.
💭 Conclusion: False. The debate's winning side convincingly argued that while the CAPE ratio is indeed elevated at approximately 34, comparing it directly to the dot-com bubble era is misleading because the structural composition of today's market differs fundamentally. The current elevated CAPE is driven by mega-cap technology firms with strong fundamentals, massive cash reserves, and dominant market positions, whereas the dot-com era was characterized by speculative companies with negligible or negative cash flows . Historical comparisons to peaks like 1929 (CAPE ≈ 32.6) also fail because each era represents distinct economic regimes with different corporate governance and capital market structures. The confidence is moderated because the claim is compound: while the 'historically expensive' portion is supported by the data, the 'similar to dot-com bubble' portion is the weaker sub-claim that the FALSE side successfully contested.
🔬 DeepResearch Result: likely FALSE ❌ (65%)
Assertion: The current stock market, based on the cyclically adjusted price-to-earnings (CAPE) ratio, is approaching its most expensive levels in history, similar to the dot-com bubble .
Participating models: deepseek-v3.2 💬, gemma-4-26b-a4b-it 💬👁️
📊 Face-offs: 0 concluded TRUE, 1 concluded FALSE (1 face-offs, 3 models)
📊 Score by side: TRUE=0.00, FALSE=0.74
🏅 Model score changes:
minimax-m3 💬👁️: +7
✅ PRO Arguments:
- ■The S&P 500 CAPE ratio currently stands at approximately 34, placing it in the 99th percentile of historical valuations and roughly double the long-term average of around 17, indicating investors are paying historically high prices for corporate earnings. deepseek-v3.2 💬
- ■Tax regimes have not changed in ways that justify doubling the historical CAPE average; corporate tax rates today are broadly similar to historical levels when adjusted for inflation and deductions, and the capital gains tax structure has remained relatively stable. deepseek-v3.2 💬
❌ ANTI Arguments:
- ■Modern market valuations are structurally different from historical bubbles because the current high CAPE is driven by a concentrated group of mega-cap technology firms with unprecedented profit margins , massive cash reserves, and dominant market positions, unlike the dot-com era's speculative companies with negligible or negative cash flows . gemma-4-26b-a4b-it 💬👁️
- ■Direct comparison to historical peaks like 1929 (CAPE ≈ 32.6) is invalid because each era represents distinct economic regimes with different corporate governance , capital market structures, and liquidity mechanisms, making CAPE an unreliable absolute indicator across time periods. gemma-4-26b-a4b-it 💬👁️
💭 Reasoning: False. The debate's winning side convincingly argued that while the CAPE ratio is indeed elevated at approximately 34, comparing it directly to the dot-com bubble era is misleading because the structural composition of today's market differs fundamentally. The current elevated CAPE is driven by mega-cap technology firms with strong fundamentals, massive cash reserves, and dominant market positions, whereas the dot-com era was characterized by speculative companies with negligible or negative cash flows. Historical comparisons to peaks like 1929 (CAPE ≈ 32.6) also fail because each era represents distinct economic regimes with different corporate governance and capital market structures. The confidence is moderated because the claim is compound: while the 'historically expensive' portion is supported by the data, the 'similar to dot-com bubble' portion is the weaker sub-claim that the FALSE side successfully contested.
📋 PRO Facts:
• S&P 500 CAPE ratio is approximately 34
• Current CAPE is in the 99th percentile of historical valuations
• Long-term average CAPE is approximately 17
📋 ANTI Facts:
• 1929 peak CAPE was approximately 32.6
• Current high CAPE is driven by mega-cap technology firms with unprecedented profit margins and massive cash reserves
• The dot-com era was characterized by companies with negligible or negative cash flows and no clear paths to profitability
| Face-off | TRUE Model | FALSE Model | TRUE Avg μ | FALSE Avg μ | TRUE Tokens | FALSE Tokens | Winner | Verdict | Conf. |
|---|---|---|---|---|---|---|---|---|---|
| #1 | deepseek-v3.2 💬 | gemma-4-26b-a4b-it 💬👁️ | 0.406 | 0.167 | 8 | 2 | TRUE | FALSE | 74% |
The following technical terms, abbreviations, and domain-specific concepts are referenced throughout this debate transcript. Numbers in square brackets [N] in the text above link to the corresponding entry below.
[1] 10-Year Treasury Yield — 10-Year U.S. Treasury Yield — The interest rate on U.S. government debt maturing in ten years, used in the debate as a benchmark for the prevailing interest rate environment across different historical periods.
[2] CAPE ratio — Cyclically Adjusted Price-to-Earnings ratio — A valuation metric that smooths corporate earnings over a 10-year window to remove cyclical fluctuations, developed by Robert Shiller. The debate cites a current reading of approximately 34 and a long-term average of around 17.
[3] capital gains tax — A tax levied on the profit realized from the sale of an asset; the affirmative argues its structure has remained relatively stable over the CAPE measurement period.
[4] capital markets — Markets in which securities are issued and traded; referenced in the negative's argument about 'efficient capital markets' as a structural feature distinguishing modern markets from 1929.
[5] cash flows — The net movement of money into or out of a business; the negative contrasts the negative or negligible cash flows of dot-com era firms with the strong cash generation of current mega-cap technology firms.
[6] corporate governance — The system of rules, practices, and processes by which a company is directed and controlled; cited as a structural difference between the 1929 era and modern markets.
[7] corporate tax rates — The statutory tax rates applied to corporate profits; the affirmative argues these are broadly similar to historical levels when adjusted for inflation and deductions.
[8] CPI — Consumer Price Index — An index measuring the average change in prices paid by consumers for a basket of goods and services; used in the debate's table to calculate real interest rates as 'nominal yield minus CPI inflation.'
[9] credit-driven expansion — An economic expansion fueled primarily by the expansion of borrowing and credit; cited by the negative as a key feature of the pre-2008 financial crisis peak.
[10] cyclical fluctuations — Recurring ups and downs in economic activity tied to the business cycle; the CAPE ratio is designed to smooth these out by averaging earnings over 10 years.
[11] dot-com bubble — A stock market bubble in the late 1990s and early 2000s centered on internet-related companies, during which the CAPE ratio reached approximately 44 in December 1999.
[12] efficient capital markets — Markets in which asset prices fully reflect all available information; invoked by the negative as a structural feature of modern markets absent in 1929.
[13] irrational exuberance — A phrase used by the negative to characterize the speculative behavior of dot-com era investors in companies with negligible or negative cash flows and no clear path to profitability.
[14] leverage — The use of borrowed capital to amplify investment returns; cited by the negative as a driver of the pre-2008 financial crisis peak (CAPE ≈ 27).
[15] liquidity-providing mechanisms — Institutional features (such as central bank operations and market makers) that ensure market participants can buy and sell securities; cited as a structural difference between 1929 and modern markets.
[16] mega-cap — Mega-Capitalization — A classification for companies with the largest market capitalizations; the negative argues current high CAPE levels are driven by a concentrated group of mega-cap technology firms.
[17] nominal interest rates — Stated interest rates before adjustment for inflation; the negative argues the historical 'long-term average' CAPE of 17 reflects an era of higher nominal rates.
[18] percentile (historical) — Historical Percentile — A statistical ranking indicating where a current value sits relative to its historical distribution; the affirmative states the current CAPE of 34 places it in the 99th percentile of historical valuations.
[19] price-to-earnings (P/E) — Price-to-Earnings Ratio — A valuation metric dividing a company's share price by its earnings per share; the CAPE ratio is a long-term smoothed variant of this measure.
[20] profit margins — A measure of profitability calculated as net income divided by revenue; the negative cites 'unprecedented profit margins' as a feature of current mega-cap technology firms.
[21] real interest rate — The nominal interest rate adjusted for inflation; defined in the debate's table as 'nominal yield minus CPI inflation.'
[22] S&P 500 — Standard & Poor's 500 — A stock market index tracking 500 of the largest publicly traded companies in the United States; used in the debate as the proxy for 'large cap' market valuations.
[23] share buybacks — Transactions in which a company repurchases its own outstanding shares; cited by the negative as a structural factor the CAPE ratio does not account for.
[24] shareholder protection — Legal and regulatory safeguards for the interests of company shareholders; cited as a structural feature absent in 1929 but present in modern markets.
[25] valuation — The process of determining the current worth of an asset or company; the central subject of the debate, with the affirmative arguing current valuations are historically extreme and the negative disputing the comparability of historical benchmarks.
The following financial data tables were referenced during the debate exchanges:
| Period | CAPE Ratio | Historical Percentile | Subsequent 10-Year Real Return |
|---|---|---|---|
| Current (2024) | 34.0 | 99th | 0-2% (projected) |
| Dot-Com Peak (1999) | 44.0 | 100th | -1.9% (actual) |
| 1929 Peak | 32.6 | 98th | -0.2% (actual) |
| Long-Term Average | 17.0 | 50th | 6.7% (average) |
Legend: CAPE ratio comparisons showing current valuation approaching historical extremes. Historical data from Shiller's database showing actual subsequent returns following high CAPE periods.
| Metric | Dot-Com Era (1999) | Modern Era (2024) | Structural Difference |
|---|---|---|---|
| Primary Driver | Speculative Growth | Cash-Flow Dominance | Profitability Profile |
| Earnings Quality | Low/Negative | High/Stable | Margin Consistency |
| Capital Return | Negligible | High (Buybacks/Dividends) | Shareholder Yield |
| Interest Rate Regime | High/Volatile | Low/Stable Real Rates | Cost of Capital |
Legend: Comparison of market drivers between the 1999 dot-com peak and current market conditions. Highlights the qualitative shift in why multiples are elevated.
| Period | 10-Year Treasury Yield | Real Interest Rate | CAPE Ratio |
|---|---|---|---|
| 1950-1965 | 2.0-4.0% | 0.5-2.5% | 15-20 |
| 1970s | 5.0-9.0% | -2.0 to -4.0% | 8-12 |
| 1990s | -5.0-8.0% | 2.0-4.0% | 20-44 |
| Current (2024) | 4.0.5.0% | 1.0-2.0% | 34.0 |
Legend: Historical interest rate comparisons showing periods with rates comparable to today yet lower CAPE ratios. Real interest rates calculated as nominal yield minus CPI inflation.
Face-off transcripts
- ■
Ownership & Trade Secrets. The Company Lambda Vision retains all rights to its platform, agentic workflows, and proprietary financial methodologies, which constitute protected Trade Secrets (EU Directive 2016/943). Subject to full payment of credits, the User is granted ownership of the generated Reports for their own professional use. Reverse-engineering the Service or using Reports to train competing AI models is strictly prohibited.
- ■
No Financial Advice. The Service and Reports are for informational purposes only and do not constitute financial, investment, legal, or tax advice. The Company is not a regulated financial advisor. AI-generated outputs may contain errors; the User is solely responsible for verifying data and assumes all risks for any financial decisions or losses.
- ■
Liability & Governing Law. To the maximum extent permitted by law, the Company shall not be liable for any indirect or financial damages. These Terms are governed by French law. Any disputes shall be subject to the exclusive jurisdiction of the Courts of Paris, France.