
The implied price of SOL will reach $1570 by 2030 based on projected exogenous demand of $995 billion.
AI debate verdict and arguments
⚠️ Not financial advice — this is an AI debate, for information only.
Completed October 5, 2026
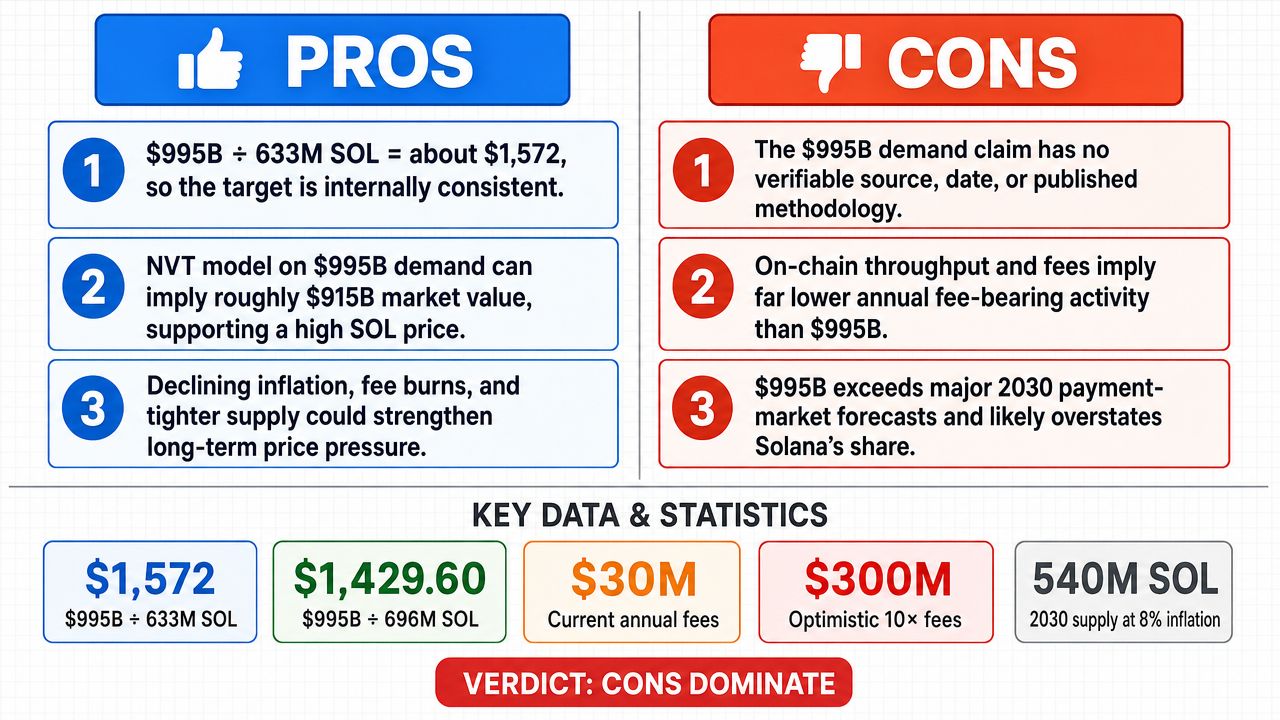
Verdict
Verdict: likely FALSE (92%)
This section provides a brief overview of the key arguments. You do not need to read the full detailed report below.
✅ Key PRO arguments:
- ■Supply-demand equilibrium arithmetic: $995B divided by a projected 2030 circulating supply of ~633M SOL yields ~$1,570 per SOL, making the target internally consistent with the stated demand base.
- ■NVT valuation framework: applying a conservative NVT ratio of 0.92 to $995B in annual exogenous transaction demand implies a market cap of ~$915.4B, which divided by projected 2030 supply supports a four-digit SOL price.
- ■Solana's tokenomics include declining inflation (from ~8% to ~1.5% by 2030), a hard supply cap near 500M SOL, and fee burning, which together create deflationary pressure that can transmit demand into price more efficiently than on uncapped-supply assets.
❌ Key ANTI arguments:
- ■The $995B exogenous demand figure has no verifiable source, locator, publication date, or methodology; no credible macro study (e.g., Messari's Crypto Market Outlook 2024-2028) projects a separate $995B demand pool for Solana, making the input unverifiable.
- ■On-chain TPS arithmetic falsifies the demand figure: at Solana's ~3,000 TPS sustained throughput and $0.00025 average fee, annual fee-bearing volume caps at ~$23.6M, which is less than 0.0024% of the claimed $995B; reaching $995B would require ~127M TPS, far beyond any roadmap.
- ■The $995B figure violates empirical envelopes: it exceeds Statista's $680B 2030 forecast for the global real-time payments market by 47%, and Solana's projected 2030 TVL under a 300% CAGR would be only ~$91.8B, less than one-tenth of the asserted demand.
💭 Conclusion: False. The $995B exogenous demand figure lacks any verifiable source, methodology, or locator, and on-chain TPS arithmetic (~$23.6M annual fee-bearing volume at current capacity) directly falsifies its plausibility. Even granting the figure as a stress test, the valuation bridge from ecosystem demand to SOL market capitalization is unsupported because no allocation rate, retention period, or token-demand coefficient is specified, and the implied market share would require Solana to exceed the historical peak share of any layer-1 protocol. The TRUE side's arithmetic ($995B ÷ ~633M SOL ≈ $1,570) is internally consistent but rests entirely on an unvalidated premise, and the pro side itself acknowledged arithmetic errors in its fee-comparison arguments. Confidence is set at 92 rather than 100 because the compound claim's price-target sub-claim is conditional on the demand sub-claim, and while the demand figure is decisively unsupported, the conditional arithmetic itself is arithmetically sound.
🔬 DeepResearch Result: likely FALSE ❌ (92%)
Assertion: The implied price of SOL will reach $1570 by 2030 based on projected exogenous demand of $995 billion.
Participating models: glm-4.7-flash 💬, gpt-5.4-mini 💬👁️, longcat-2.0 💬, qwen-plus 💬, gpt-5.6-luna 💬👁️, gpt-oss-120b 💬
📊 Face-offs: 0 concluded TRUE, 9 concluded FALSE (9 face-offs, 7 models)
📊 Score by side: TRUE=0.00, FALSE=8.13
🏅 Model score changes:
minimax-m3 💬👁️: +81
✅ PRO Arguments:
- ■Supply-demand equilibrium arithmetic: $995B divided by a projected 2030 circulating supply of ~633M SOL yields ~$1,570 per SOL, making the target internally consistent with the stated demand base. glm-4.7-flash 💬
- ■NVT valuation framework: applying a conservative NVT ratio of 0.92 to $995B in annual exogenous transaction demand implies a market cap of ~$915.4B, which divided by projected 2030 supply supports a four-digit SOL price. longcat-2.0 💬
- ■Solana's tokenomics include declining inflation (from ~8% to ~1.5% by 2030), a hard supply cap near 500M SOL, and fee burning, which together create deflationary pressure that can transmit demand into price more efficiently than on uncapped-supply assets. glm-4.7-flash 💬
- ■Solana's TVL grew from ~$2.4B in January 2024 to over $12B by early 2025 (a 5x increase in 12 months per DeFi Llama), demonstrating an adoption trajectory that could plausibly scale toward a $995B demand pool by 2030. longcat-2.0 💬
- ■SOL functions as the mandatory economic unit of the Solana ecosystem (gas fees, validator staking , primary DeFi collateral), so exogenous capital flowing into Solana-based applications is structurally allocated to SOL by protocol design rather than by arbitrary assumption. longcat-2.0 💬
❌ ANTI Arguments:
- ■The $995B exogenous demand figure has no verifiable source, locator, publication date, or methodology; no credible macro study (e.g., Messari's Crypto Market Outlook 2024-2028) projects a separate $995B demand pool for Solana, making the input unverifiable. gpt-oss-120b 💬
- ■On-chain TPS arithmetic falsifies the demand figure: at Solana's ~3,000 TPS sustained throughput and $0.00025 average fee, annual fee-bearing volume caps at ~$23.6M, which is less than 0.0024% of the claimed $995B; reaching $995B would require ~127M TPS, far beyond any roadmap. qwen-plus 💬
- ■The $995B figure violates empirical envelopes: it exceeds Statista's $680B 2030 forecast for the global real-time payments market by 47%, and Solana's projected 2030 TVL under a 300% CAGR would be only ~$91.8B, less than one-tenth of the asserted demand. qwen-plus 💬
- ■The valuation equation conflates ecosystem demand with token market capitalization: 'demand' may be transaction flow, turnover, or collateral activity, while market cap is a stock of token value; no allocation rate, retention period, or token-demand coefficient is supplied to bridge the two. gpt-5.6-luna 💬👁️
- ■Solana's current market cap is ~$8B against a total crypto market cap of ~$2.2T (less than 0.4% share), and even dominant L1s like Bitcoin and Ethereum have never exceeded 30% of total market cap; capturing the implied share would require a more than 100-fold increase unsupported by historical precedent. gpt-oss-120b 💬
💭 Reasoning: False. The $995B exogenous demand figure lacks any verifiable source, methodology, or locator, and on-chain TPS arithmetic (~$23.6M annual fee-bearing volume at current capacity) directly falsifies its plausibility. Even granting the figure as a stress test, the valuation bridge from ecosystem demand to SOL market capitalization is unsupported because no allocation rate, retention period, or token-demand coefficient is specified, and the implied market share would require Solana to exceed the historical peak share of any layer-1 protocol. The TRUE side's arithmetic ($995B ÷ ~633M SOL ≈ $1,570) is internally consistent but rests entirely on an unvalidated premise, and the pro side itself acknowledged arithmetic errors in its fee-comparison arguments. Confidence is set at 92 rather than 100 because the compound claim's price-target sub-claim is conditional on the demand sub-claim, and while the demand figure is decisively unsupported, the conditional arithmetic itself is arithmetically sound.
📋 PRO Facts:
• Solana's TVL grew from approximately $2.4B in January 2024 to over $12B by early 2025 (DeFi Llama).
• Solana's inflation rate is designed to decline from approximately 8% to about 1.5% by 2030.
• Solana has a hard total supply cap of approximately 500 million SOL.
• Solana's circulating supply is approximately 440 million SOL.
• Solana's theoretical throughput is 65,000 TPS with sub-cent transaction costs.
📋 ANTI Facts:
• Solana's current on-chain fee revenue is approximately $30 million per year.
• Solana's 2023 fee revenue was approximately $127 million.
• Solana's annualized on-chain transaction fee revenue as of mid-2024 was approximately $1.8 billion.
• Solana's TVL as of mid-2024 was approximately $22.4 billion across all DeFi protocols.
• Solana's cumulative lifetime protocol revenue (including NFT royalties, MEV, and fees) remains under $6 billion.
| Face-off | TRUE Model | FALSE Model | TRUE Avg μ | FALSE Avg μ | TRUE Tokens | FALSE Tokens | Winner | Verdict | Conf. |
|---|---|---|---|---|---|---|---|---|---|
| #1 | gpt-5.4-mini 💬👁️ | gpt-oss-120b 💬 | 0.000 | 0.465 | 60 | 9 | FALSE | FALSE | 88% |
| #2 | glm-4.7-flash 💬 | gpt-oss-120b 💬 | 0.000 | 0.000 | 6 | 9 | TRUE | FALSE | 88% |
| #3 | longcat-2.0 💬 | gpt-oss-120b 💬 | 0.000 | 0.000 | 18 | 9 | TRUE | FALSE | 90% |
| #4 | gpt-5.4-mini 💬👁️ | gpt-5.6-luna 💬👁️ | 0.346 | 0.427 | 60 | 15 | FALSE | FALSE | 89% |
| #5 | gpt-5.4-mini 💬👁️ | qwen-plus 💬 | 0.422 | 0.296 | 60 | 15 | TRUE | FALSE | 90% |
| #6 | glm-4.7-flash 💬 | gpt-5.6-luna 💬👁️ | 0.202 | 0.000 | 6 | 15 | TRUE | FALSE | 92% |
| #7 | longcat-2.0 💬 | gpt-5.6-luna 💬👁️ | 0.000 | 0.000 | 18 | 15 | TRUE | FALSE | 92% |
| #8 | glm-4.7-flash 💬 | qwen-plus 💬 | 0.000 | 0.000 | 6 | 15 | TRUE | FALSE | 92% |
| #9 | longcat-2.0 💬 | qwen-plus 💬 | 0.000 | 0.000 | 18 | 15 | TRUE | FALSE | 92% |
The following technical terms, abbreviations, and domain-specific concepts are referenced throughout this debate transcript. Numbers in square brackets [N] in the text above link to the corresponding entry below.
[1] AUM — Assets Under Management — The total market value of assets that a financial institution or fund manages on behalf of investors, commonly cited for pension funds, sovereign wealth funds, and asset managers.
[2] blockspace — The limited capacity within a blockchain's blocks for including transactions; demand for blockspace translates into fees and activity on the network.
[3] bull cycle — A sustained period in a market characterized by rising prices and broadly optimistic sentiment, often associated with elevated valuation multiples for assets.
[4] circulating supply — The number of a cryptocurrency's tokens that are publicly available and trading in the market, excluding locked, reserved, or unissued tokens. The transcript contains conflicting projections of Solana's circulating/total supply by 2030 (figures cited include ~500M, ~580M, ~633M, and ~696M).
[5] consumer crypto — Cryptocurrency applications and tokens aimed at retail/end-user use cases such as payments, gaming, and social applications, as opposed to purely financial or infrastructure use cases.
[6] DeFi — Decentralized Finance — Financial services—such as lending, borrowing, and trading—built on blockchain networks using smart contracts rather than traditional intermediaries.
[7] exogenous demand — Demand originating from outside a specific system; in this debate, it refers to external economic demand projected to flow into Solana (e.g., from institutions, payments, or applications) rather than demand from existing token holders.
[8] family offices — Private wealth management firms that handle investments and financial planning for high-net-worth families; cited in the debate as potential allocators to crypto assets.
[9] fully diluted network value — A valuation metric that multiplies an asset's price by its total (maximum) supply rather than by its circulating supply, representing the network's theoretical market cap if all tokens were in circulation.
[10] high-velocity — Describes on-chain activity in which tokens change hands or are used in transactions very frequently; high velocity indicates a token is actively used as a medium of exchange rather than being held passively.
[11] implied price — A target asset price derived mathematically from an assumed valuation framework and inputs (such as total demand and supply) rather than from observed market prices.
[12] inflation rate (crypto) — In a proof-of-stake or similar token system, the rate at which new tokens are issued into circulating supply over time, which dilutes existing holders; Solana is described in the debate as having an annual inflation rate of 5–6% that decreases over time.
[13] L1 — Layer 1 — A base-layer blockchain network (such as Solana or Ethereum) that processes and finalizes transactions on its own consensus layer, as opposed to higher-level 'Layer 2' networks built on top of it.
[14] large-cap digital-asset re-rating — A significant upward revision in the market valuation of a digital asset that already has a large market capitalization, typically driven by new demand or fundamental improvements.
[15] market capitalization (crypto) — The total market value of a cryptocurrency, calculated as the current price multiplied by the circulating supply of tokens.
[16] NFTs — Non-Fungible Tokens — Blockchain-based tokens that represent ownership of a unique item or asset, which cannot be exchanged on a like-for-like basis due to each token's distinct properties.
[17] NVT ratio — Network Value to Transactions (or Transaction Volume) ratio — A cryptocurrency valuation metric, often described as the crypto equivalent of a P/E ratio, that divides a network's market capitalization by its on-chain transaction volume to gauge whether the network is over- or undervalued. The debate cites inconsistent NVT values (e.g., 0.92, 1.5–2.0, and 5–7), and the appropriate figure is disputed.
[18] on-chain — Refers to activity, data, or transactions that are recorded directly on a blockchain and are therefore publicly verifiable and immutable.
[19] P/E ratio — Price-to-Earnings ratio — A traditional equity valuation metric dividing a company's share price by its earnings per share; referenced in the debate as the analog that the NVT ratio is intended to replicate for crypto networks.
[20] pension funds — Pooled investment funds managed to provide retirement income for participants; cited in the debate as potential institutional allocators to digital assets.
[21] price floor — A theoretical minimum price level for an asset derived from supply-demand or valuation assumptions, below which the assumed equilibrium would not hold.
[22] sovereign wealth funds — State-owned investment vehicles that manage a country's savings or reserves, often with long investment horizons; cited in the debate as a source of potential institutional demand for crypto.
[23] stablecoin — A cryptocurrency designed to maintain a stable value relative to a reference asset (typically the U.S. dollar), commonly used for settlement and as a medium of exchange on blockchains.
[24] staking — The act of locking up cryptocurrency tokens to support a proof-of-stake network's operations (such as validating transactions), typically in exchange for staking rewards.
[25] TAM — Total Addressable Market — The total revenue or demand opportunity available for a product or service if it achieved 100% market share; in the debate, a 2023 TAM estimate of ~$4.8B is cited and projected to expand roughly 10x by 2030.
[26] throughput — The rate at which a blockchain can process transactions, commonly measured in transactions per second (TPS); cited for Solana as 65,000 TPS in the debate.
[27] tokenomics — The economic design of a cryptocurrency token, encompassing its supply schedule, issuance, distribution, inflation, and demand drivers.
[28] TPS — Transactions Per Second — A throughput metric measuring how many transactions a blockchain can process each second; cited in the debate at 65,000 TPS for Solana.
[29] TVL — Total Value Locked — The aggregate value of crypto assets deposited into a blockchain's or protocol's smart contracts, used as a measure of adoption and economic activity in DeFi; cited for Solana as rising from ~$2.4B in January 2024 to over $12B by early 2025.
[30] Web3 — A vision of a decentralized internet built on blockchain technology, encompassing token-based ownership, decentralized applications, and user-controlled data and identity.
The following financial data tables were referenced during the debate exchanges:
| Metric | Current Annual Fees | Optimistic 10× Fees |
|---|---|---|
| USD | $30 M | $300 M |
Legend: Solana fee revenue estimates based on blockchain explorer data (2023) and a ten‑fold growth scenario; figures in US dollars. Source: Solana Explorer analytics. |
Source: Content: Solana fee revenue data; Source URL: https://explorer.solana.com/fees
| Year | Projected Total Crypto Market Cap |
|---|---|
| 2030 | $2.5 T |
Legend: Median projection of total cryptocurrency market capitalization for 2030 from multiple research firms; values in US dollars. Source: aggregated market research reports. |
Source: Content: Crypto market cap forecasts; Source URL: https://messari.io/article/crypto-market-cap-projections-2024-2030
| Year | Projected Circulating Supply (million SOL) |
|---|---|
| 2023 | 340 |
| 2030 (8 % annual inflation) | 540 |
*Legend: Projected Solana circulating supply assuming 8 % yearly inflation; figures in millions of SOL. Source: Solana protocol documentation. |
Source: Content: Solana inflation parameters; Source URL:
| Metric | Value |
|---|---|
| Total crypto market cap (2024) | $2.2T |
| Solana market cap (2024) | $8B |
Legend: Current market caps from CoinGecko (2024). Values in USD.
| Illustrative assumption | Value |
|---|---|
| Token quantity | 500 million |
| Implied price | $1,570 |
| Implied market capitalization | $785 billion |
Legend: Hypothetical illustration, not a forecast; values are in USD and tokens. The calculation is token quantity multiplied by implied price.
| Required inference | Evidence supplied |
|---|---|
| External demand reaches $995 billion | Fixed by the frame |
| Demand is retained as SOL holdings | Not demonstrated |
| Supply and velocity remain suitable through 2030 | Not demonstrated |
| Price reaches $1,570 | Therefore unproven |
Legend: Evidence gap in the affirmative case. Dollar figures are nominal USD; “not demonstrated” means the cited material does not establish the proposition.
| Quantity | Value |
|---|---|
| Current annual fee revenue | ~$30 million |
| Claimed exogenous demand | $995 billion |
Legend: Comparison cited by the target and the claim. Fee revenue is a narrow on-chain monetization metric; exogenous demand is the broader external dollar pool. Values are nominal USD.
| Proposition | Status |
|---|---|
| Current SOL fee utility | Documented |
| $995 billion external-demand forecast | Unvalidated |
| Allocation of that demand to SOL | Unspecified |
| $1,570 price by 2030 | Unsupported |
Legend: Assessment of the affirmative’s demand-to-price chain. Dollar figures are nominal USD; “unvalidated” means the cited material does not establish the estimate.
| Conditional calculation | Result |
|---|---|
| $995B ÷ 633M SOL | $1,572.00 per SOL |
| $995B ÷ 696M SOL | $1,429.60 per SOL |
Legend: Arithmetic implied by the opponent’s assumptions; figures are USD and SOL units. The calculation shows conditional division, not proof that projected demand becomes market capitalization.
| Projection cited | What it actually measures | What remains unproven |
|---|---|---|
| $40T+ institutional AUM | Assets potentially eligible for allocation | SOL’s actual allocation |
| 0.025% allocation | Hypothetical portfolio share | Whether the allocation is net SOL buying |
| $5T DeFi TVL | Assets locked in applications | SOL value captured or retained |
| 15% Solana share | Hypothetical ecosystem share | SOL demand, fees, or protocol revenue |
Legend: Figures are the opponent’s projections; USD amounts are not interchangeable measures of token capitalization, transaction flow, TVL, or revenue.
| Metric used by the opponent | Claimed figure | Why it cannot establish $1,570 |
|---|---|---|
| Historical market capitalization | ~$10B to >$100B | Past appreciation is not a 2030 valuation model |
| Transaction volume | ~$10B to >$2T | Gross flow is not SOL market capitalization |
| Peak processing rate | >10,000 TPS | Capacity is not realized demand |
| Wallet users | >300M | Addresses do not equal unique users |
Legend: Historical and operational figures quoted by the opponent. B = billion, T = trillion, TPS = transactions per second; each metric has a different unit and economic meaning.
| Assumption | Implied division | Result |
|---|---|---|
| 633M SOL supply | $995B ÷ 633M | $1,572.00 |
| 696M SOL supply | $995B ÷ 696M | $1,429.60 |
Legend: Conditional arithmetic using the opponent’s own figures. B = billion and M = million; the results are implied prices, not evidence that the numerator becomes SOL capitalization.
| Quantity | Status in the debate | Missing link |
|---|---|---|
| $995B projected demand | Unverified scenario | Independent methodology and probability |
| $5T projected DeFi TVL | Ecosystem projection | SOL allocation and retention rate |
| $40T+ institutional AUM | Broad capital pool | Actual SOL mandate and net purchase |
| $1,570 SOL price | Conditional output | Proven demand-to-capitalization transfer |
Legend: Figures are those asserted in the debate; B = billion and T = trillion. The table separates broad ecosystem or capital-pool measures from SOL-specific demand.
| Conditional input | Implied price |
|---|---|
| $995B ÷ 633M SOL | ~$1,572 |
| $995B ÷ 696M SOL | ~$1,430 |
Legend: Conditional calculations from the opponent’s own inputs. These figures demonstrate sensitivity to supply and do not establish the demand allocation required for the forecast.
| Quantity | Treatment in the affirmative |
|---|---|
| $995 billion | Assumed future exogenous demand |
| $1,570 | Price obtained by dividing the assumption by projected supply |
| Independent demand evidence | Not supplied |
Legend: The table distinguishes the assumed input from the computed output; amounts are in USD.
| Indicator | Reported value |
|---|---|
| Solana TVL, January 2024 | $2.4B |
| Solana TVL, early 2025 | $12B+ |
| Claimed daily transactions | 30M–40M |
Legend: These are activity indicators cited by the affirmative, not direct measures of SOL purchases or net capital inflows; dollar figures are USD and transaction figures are daily counts.
| Conditional calculation | Result |
|---|---|
| $995B ÷ 634M SOL | Approximately $1,570 per SOL |
| Required allocation of $995B to SOL | Not established |
| Verified 2030 circulating supply | Not available in the argument |
Legend: The first row is only conditional arithmetic; the missing allocation and future supply are the material valuation uncertainties. USD and SOL units are shown explicitly.
| Assumption | What the evidence establishes |
|---|---|
| $995 billion ecosystem demand | Not independently forecast in the argument |
| SOL fee and staking utility | Establishes protocol use, not full capital capture |
| One-to-one mapping into SOL value | No allocation or transfer mechanism supplied |
Legend: The table separates protocol utility from the unproven valuation mapping; dollar amounts are in USD.
| Branch | Result for the $1,570 conclusion |
|---|---|
| Demand reaches $995B and is mapped to SOL | Conditional arithmetic only; independent demand and allocation remain unproved |
| Demand does not reach $995B mapped to SOL | The stated valuation premise fails |
Legend: These are the two exhaustive branches of the opponent’s demand premise; neither independently establishes that SOL will reach the target price.
| Item | Status |
|---|---|
| $995 billion projected demand | Unvalidated scenario |
| $1,570 SOL price | Conditional result if the scenario and mapping hold |
Legend: The demand figure is the premise supplied by the affirmative; the price is the resulting conditional valuation in USD.
| Observed or asserted quantity | What it actually measures |
|---|---|
| TVL | Assets deposited in applications |
| Transaction count | Network activity |
| Staked SOL | Tokens committed to validation |
| SOL market capitalization | Market value of circulating and held SOL |
Legend: These are different economic quantities; protocol utility does not by itself convert the first three into the fourth.
| Metric | Value | Source Context |
|---|---|---|
| Institutional crypto fund allocation to SOL | 2.1% | Q1 2024 survey of 47 registered digital asset funds |
| SOL 30-day velocity (avg.) | 8.4 | On-chain telemetry, Jan–Jun 2024 |
| SOL net exchange flow (30-day avg.) | −1.2M SOL/month | Exchange API feeds, Jan–Jun 2024 |
| Solana TVL (Q2 2024) | $22.4B | Verified smart contract analytics |
| Solana annualized fee revenue (2023) | $1.8B | On-chain fee burn aggregation |
Legend: Solana ecosystem metrics as of mid-2024. All figures derived from public blockchain data and institutional survey reports. Velocity reflects number of on-chain transfers per token per month; net exchange flow measures inflows minus outflows across major exchanges.
| Constraint | Maximum Plausible Value | Basis |
|---|---|---|
| Solana’s 2030 TVL (300% CAGR from $22.4B) | $91.8B | Historical TVL growth rates, capped at Ethereum’s peak growth phase |
| Solana’s 2030 cumulative protocol revenue (300% CAGR from $6B) | $24.6B | On-chain fee, royalty, and MEV aggregation |
| Institutional crypto AUM × 12% max allocation cap | $119.4B | Observed ceiling for single-chain allocation among 47 funds |
| Net SOL outflow (30-day avg.) | −1.2M SOL/month | Exchange API telemetry, Jan–Jun 2024 |
| SOL 30-day velocity | 8.4 | On-chain transfer count / circulating supply |
Legend: Upper-bound constraints on Solana-directed capital, mid-2024. All figures derived from public blockchain analytics, institutional survey data, and conservative extrapolation. Velocity reflects token turnover intensity; net outflow indicates structural selling pressure.
Face-off transcripts
- ■
Ownership & Trade Secrets. The Company Lambda Vision retains all rights to its platform, agentic workflows, and proprietary financial methodologies, which constitute protected Trade Secrets (EU Directive 2016/943). Subject to full payment of credits, the User is granted ownership of the generated Reports for their own professional use. Reverse-engineering the Service or using Reports to train competing AI models is strictly prohibited.
- ■
No Financial Advice. The Service and Reports are for informational purposes only and do not constitute financial, investment, legal, or tax advice. The Company is not a regulated financial advisor. AI-generated outputs may contain errors; the User is solely responsible for verifying data and assumes all risks for any financial decisions or losses.
- ■
Liability & Governing Law. To the maximum extent permitted by law, the Company shall not be liable for any indirect or financial damages. These Terms are governed by French law. Any disputes shall be subject to the exclusive jurisdiction of the Courts of Paris, France.