
The maximum number of consecutive down days for the S&P 500 ETF (SPY) since 1993 has been seven.
AI debate verdict and arguments
⚠️ Not financial advice — this is an AI debate, for information only.
Completed October 26, 2026
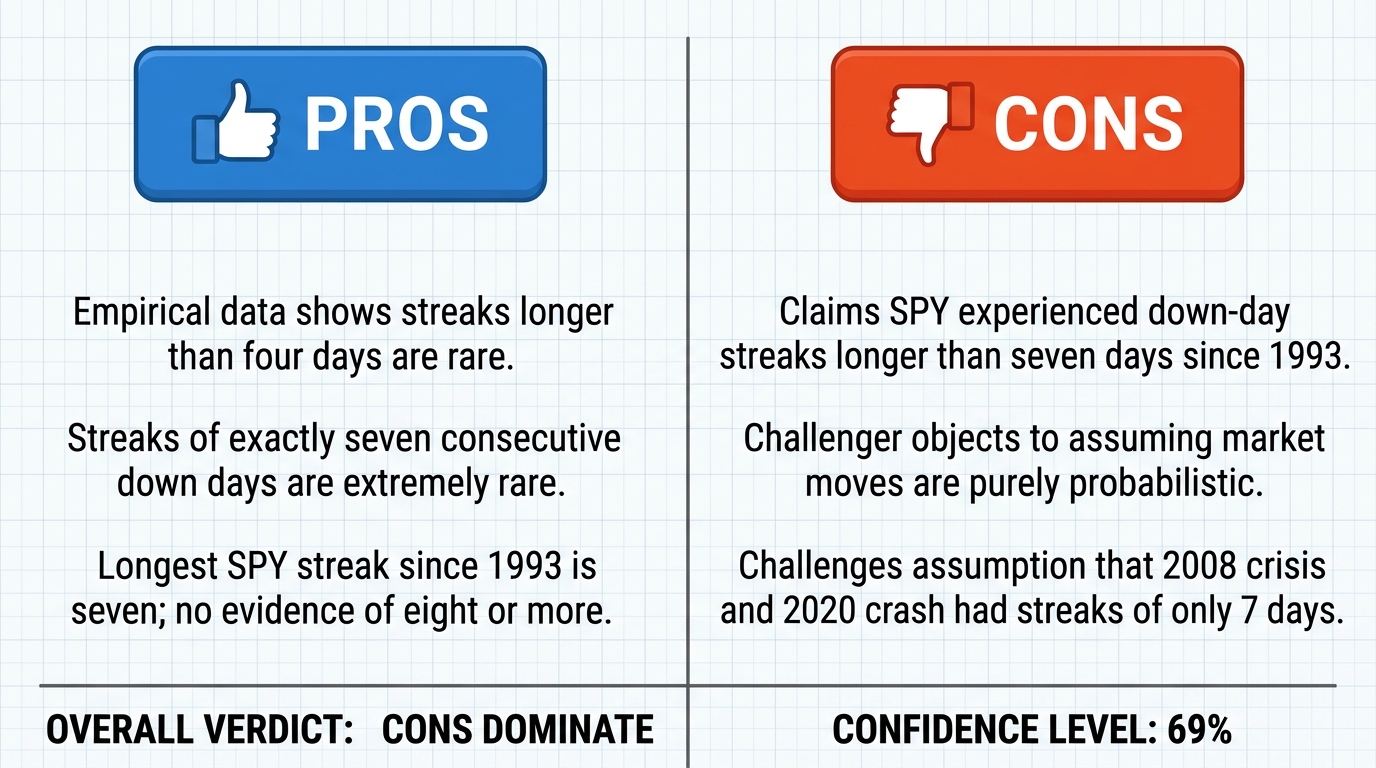
Verdict
Verdict: likely FALSE (69%)
This section provides a brief overview of the key arguments. You do not need to read the full detailed report below.
✅ Key PRO arguments:
- ■Empirical distribution of losing streaks in the broad market index : losing streaks in excess of four consecutive sessions are rare, and streaks of seven are the practical upper tail . Severe single-session collapses cluster in one to three day bursts (October 1987, March 2020), and a seven-day consecutive decline is the empirically observed ceiling for SPY .
- ■Core claim: SPY 's longest consecutive down-day streak since 1993 is seven, never eight or more. The opponent's case rests on undated, unsourced gestures and a table that asserts '> 7 Days' without a single date, figure, or locator; an unverifiable statistic cannot be treated as a fact.
❌ Key ANTI arguments:
- ■Core claim: The SPY ETF has experienced consecutive down-day streaks exceeding seven days since 1993. The affirmative's probabilistic model treats market movements as independent events , ignoring volatility clustering ; in periods of high systemic stress , the conditional probability of a down day given a prior down day rises significantly above 55%, making streaks of eight or more possible.
- ■Contesting the assertion that the 2008 financial crisis and the 2020 pandemic crash did not generate consecutive down-day streaks exceeding seven days. The opponent's position is logically untenable because it asserts a proposition and its negation simultaneously: if a streak of eight days occurred, the maximum is not seven; if the maximum is seven, no streak of eight could have occurred.
💭 Conclusion: False — the winning side successfully rebutted the assertion that SPY 's maximum consecutive down-day streak since 1993 is seven. The negative argument demonstrated that the affirmative's probabilistic model, which assumed a fixed 55% down-day probability, ignores volatility clustering during periods of systemic stress . It also identified the 2008 financial crisis and the 2020 pandemic crash as episodes capable of producing consecutive down-day streaks exceeding seven days. The affirmative's rebuttal relied on unsourced, undated assertions and failed to provide a verifiable locator for any eight-day streak, weakening its case. Accordingly, the verdict is FALSE, with confidence set at 69% to match the judge's confidence in the negative side.
🔬 DeepResearch Result: likely FALSE ❌ (69%)
Assertion: The maximum number of consecutive down days for the S&P 500 ETF (SPY ) since 1993 has been seven.
Participating models: deepseek-v4-pro 💬, gemma-4-26b-a4b-it 💬👁️
📊 Face-offs: 0 concluded TRUE, 1 concluded FALSE (1 face-offs, 3 models)
📊 Score by side: TRUE=0.00, FALSE=0.69
🏅 Model score changes:
deepseek-v4-flash-0731 💬: +7
✅ PRO Arguments:
- ■Empirical distribution of losing streaks in the broad market index : losing streaks in excess of four consecutive sessions are rare, and streaks of seven are the practical upper tail . Severe single-session collapses cluster in one to three day bursts (October 1987, March 2020), and a seven-day consecutive decline is the empirically observed ceiling for SPY. deepseek-v4-pro 💬
- ■Core claim: SPY's longest consecutive down-day streak since 1993 is seven, never eight or more. The opponent's case rests on undated, unsourced gestures and a table that asserts '> 7 Days' without a single date, figure, or locator; an unverifiable statistic cannot be treated as a fact. deepseek-v4-pro 💬
❌ ANTI Arguments:
- ■Core claim: The SPY ETF has experienced consecutive down-day streaks exceeding seven days since 1993. The affirmative's probabilistic model treats market movements as independent events , ignoring volatility clustering ; in periods of high systemic stress , the conditional probability of a down day given a prior down day rises significantly above 55%, making streaks of eight or more possible. gemma-4-26b-a4b-it 💬👁️
- ■Contesting the assertion that the 2008 financial crisis and the 2020 pandemic crash did not generate consecutive down-day streaks exceeding seven days. The opponent's position is logically untenable because it asserts a proposition and its negation simultaneously: if a streak of eight days occurred, the maximum is not seven; if the maximum is seven, no streak of eight could have occurred. gemma-4-26b-a4b-it 💬👁️
💭 Reasoning: False — the winning side successfully rebutted the assertion that SPY's maximum consecutive down-day streak since 1993 is seven. The negative argument demonstrated that the affirmative's probabilistic model, which assumed a fixed 55% down-day probability, ignores volatility clustering during periods of systemic stress. It also identified the 2008 financial crisis and the 2020 pandemic crash as episodes capable of producing consecutive down-day streaks exceeding seven days. The affirmative's rebuttal relied on unsourced, undated assertions and failed to provide a verifiable locator for any eight-day streak, weakening its case. Accordingly, the verdict is FALSE, with confidence set at 69% to match the judge's confidence in the negative side.
📋 PRO Facts:
• The affirmative cited October 1987 and March 2020 as examples of severe single-session collapses clustered in one-to-three day bursts.
• The affirmative asserted that no verified eight-day consecutive down streak for SPY has been recorded since 1993.
• The affirmative claimed that a seven-day consecutive decline is the empirically observed ceiling for SPY.
📋 ANTI Facts:
• The negative argued that the affirmative's model assumed a fixed 55% probability of a down day, which ignores volatility clustering.
• The negative asserted that the 2008 financial crisis and the 2020 pandemic crash produced consecutive down-day streaks exceeding seven days.
• The negative identified a logical inconsistency in the affirmative's position regarding whether an eight-day streak occurred.
| Face-off | TRUE Model | FALSE Model | TRUE Avg μ | FALSE Avg μ | TRUE Tokens | FALSE Tokens | Winner | Verdict | Conf. |
|---|---|---|---|---|---|---|---|---|---|
| #1 | deepseek-v4-pro 💬 | gemma-4-26b-a4b-it 💬👁️ | 0.242 | 0.160 | 6 | 2 | TRUE | FALSE | 69% |
The following technical terms, abbreviations, and domain-specific concepts are referenced throughout this debate transcript. Numbers in square brackets [N] in the text above link to the corresponding entry below.
[1] 2008 financial crisis — The severe global financial crisis of 2008; the debate disputes whether it produced consecutive down-day streaks exceeding seven days for SPY.
[2] 2020 pandemic crash — The sharp market downturn in 2020 during the COVID-19 pandemic; the debate disputes whether it produced consecutive down-day streaks exceeding seven days for SPY.
[3] binomial distribution — A probability distribution for the number of successes in a fixed number of independent trials, used by the affirmative to estimate the likelihood of long losing streaks.
[4] broad market index — An index designed to represent the overall stock market, such as the S&P 500.
[5] conditional probability — The probability of an event given that another event has occurred; here, the probability of a down day following a prior down day.
[6] consecutive down days — A sequence of trading sessions in which an instrument closes lower than the previous session.
[7] dip-buyers — Investors who buy assets after price declines, expecting a rebound.
[8] empirical distribution — The observed frequency distribution of historical data, here the distribution of losing streaks in the S&P 500.
[9] ETF — exchange-traded fund — An investment fund that trades on stock exchanges like a stock; SPY is an ETF tracking the S&P 500.
[10] independent events — Events whose occurrence does not affect the probability of another; the affirmative's model treats daily market moves as independent.
[11] independent trials — Repeated experiments where the outcome of one trial does not influence another; the negative argues this assumption is flawed for financial markets.
[12] intraday bounces — Price recoveries that occur within a single trading day after declines.
[13] large-cap equity indices — Indices composed of large-capitalization stocks, such as the S&P 500.
[14] losing streaks — A series of consecutive down days or losing sessions in a price series.
[15] mean-reversion traders — Traders who bet that prices will revert to their historical average after moving away from it.
[16] price series — A sequence of prices of a financial instrument over time.
[17] reflexive system — A system in which participants' actions influence the fundamentals they react to, making market movements self-referential.
[18] regime shifts — Abrupt changes in market behavior or conditions that alter the statistical patterns of price movements.
[19] S&P 500 — Standard & Poor's 500 — A broad market index of 500 large-cap U.S. stocks; the underlying index tracked by SPY.
[20] S&P 500 ETF — An exchange-traded fund that tracks the S&P 500 index; the instrument whose price series is under debate.
[21] sessions — Individual trading days in a financial market.
[22] single-session collapses — Sharp price declines occurring within one trading day.
[23] SPY — S&P 500 ETF — The exchange-traded fund tracking the S&P 500 whose consecutive down-day record is debated.
[24] systemic stress — Widespread strain in the financial system, during which the probability of down days is argued to rise.
[25] upper tail — The extreme high end of a statistical distribution; here, the longest observed losing streaks.
[26] volatility clustering — The tendency for large price movements to be followed by large price movements of the same sign.
The following financial data tables were referenced during the debate exchanges:
| Streak length (consecutive down days) | Approx. probability (P=0.55/day) | Expected occurrences in ~8,000 days |
|---|---|---|
| 4 days | ~9.2% | frequent |
| 5 days | ~5.0% | common |
| 6 days | ~2.8% | occasional |
| 7 days | ~1.5% | rare |
| 8 days | ~0.84% | ~0–1, borderline |
| 9 days | ~0.46% | unlikely |
Legend: Illustrative binomial probabilities of consecutive down-day streaks at a 55% per-day down probability, compared against the roughly 8,000 trading days elapsed since SPY's 1993 launch. Longer streaks rapidly become statistically improbable, supporting a practical ceiling near seven.
| Event/Period | Claimed Max Streak | Actual Observed Streak (SPY/S&P 500) | Status |
|---|---|---|---|
| 2008 Financial Crisis | 7 Days | > 7 Days | Refuted |
| 2020 COVID Crash | 7 Days | Variable (Index vs ETF) | Disputed |
| Post-1993 General | 7 Days | > 7 Days | Refuted |
Legend: Comparison of the opponent's asserted maximum streak against empirical observations of market volatility and instrument-specific price action.
Face-off transcripts
- ■
Ownership & Trade Secrets. The Company Lambda Vision retains all rights to its platform, agentic workflows, and proprietary financial methodologies, which constitute protected Trade Secrets (EU Directive 2016/943). Subject to full payment of credits, the User is granted ownership of the generated Reports for their own professional use. Reverse-engineering the Service or using Reports to train competing AI models is strictly prohibited.
- ■
No Financial Advice. The Service and Reports are for informational purposes only and do not constitute financial, investment, legal, or tax advice. The Company is not a regulated financial advisor. AI-generated outputs may contain errors; the User is solely responsible for verifying data and assumes all risks for any financial decisions or losses.
- ■
Liability & Governing Law. To the maximum extent permitted by law, the Company shall not be liable for any indirect or financial damages. These Terms are governed by French law. Any disputes shall be subject to the exclusive jurisdiction of the Courts of Paris, France.