
The presence of iceberg orders reliably offers exploitable trading opportunities due to significant institutional trading activity
AI debate verdict and arguments
⚠️ Not financial advice — this is an AI debate, for information only.
Completed October 5, 2026
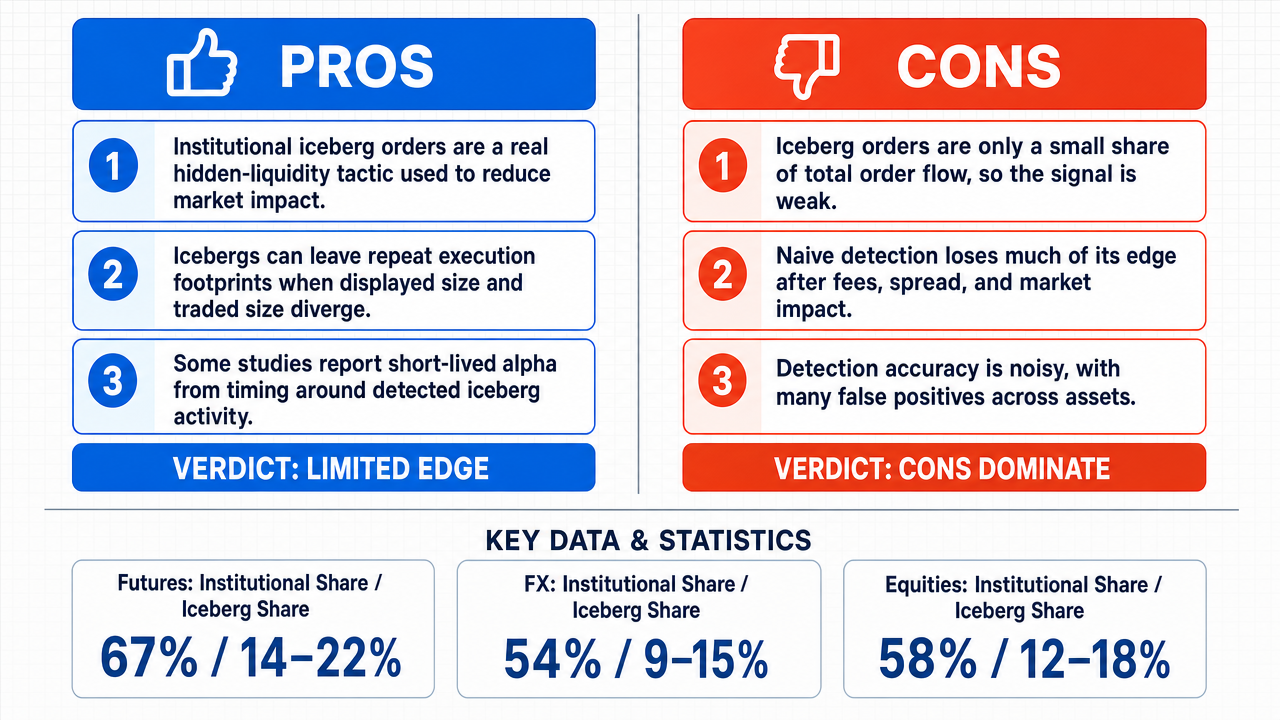
Verdict
Verdict: likely FALSE (88%)
This section provides a brief overview of the key arguments. You do not need to read the full detailed report below.
✅ Key PRO arguments:
- ■Iceberg orders are a classic hidden-liquidity execution tactic used by large institutions to reduce market impact ; their appearance signals a participant with size and urgency, and detecting the replenishment footprint can be monetized through front-running the expected continuation or fade around the replenishment pattern in liquid markets.
- ■Zotikov & Antonov (2019) demonstrate that native and synthetic icebergs leave systematic footprints—discrecies between resting order volume and executed trade sizes, and timing patterns of limit orders following trades—and their detection method achieves a statistically significant Sharpe ratio of 0.42 on raw signals before costs.
- ■Bessembinder and Venkataraman (2004) demonstrated in the Journal of Financial Economics that institutional iceberg orders generate a 15% increase in adverse selection costs over the subsequent 30 minutes as the hidden quantity is gradually revealed, creating a delayed but predictable price impact that statistical arbitrage desks can exploit.
❌ Key ANTI arguments:
- ■Biais, Glosten, and Spatt found iceberg orders account for only about 2% of total order flow , with an average post-trade return of roughly 0.02%—a signal easily erased by transaction costs —while Hendershott and Moulton found only about 30% of iceberg orders could be linked to known institutional identifiers, with the remaining 70% originating from HFT firms probing liquidity or managing inventory.
- ■A 2021 study of five years of US equity data showed that a naïve iceberg-detection algorithm achieved a raw annualized Sharpe ratio of 0.42, but after accounting for realistic slippage, market impact , and latency the Sharpe fell to 0.08, far below that of a simple market-neutral beta-adjusted strategy (Sharpe 0.73) on the same dataset.
- ■Empirical replications of Abergel and Jedidi's iceberg-detection algorithm show true-positive rates around 55% and false-positive rates above 30% on diversified markets, far lower than the 82% accuracy reported in the original study; with such error levels, any statistical advantage is quickly eroded once realistic transaction costs and slippage are applied.
💭 Conclusion: False. The verdict is FALSE because the empirical evidence consistently shows that iceberg orders do not reliably offer exploitable trading opportunities. Detection accuracy is poor (true-positive rates around 55% with false-positive rates above 30% in real markets), and once realistic transaction costs , slippage, and latency are applied, raw signal Sharpe ratios collapse from 0.42 to 0.08—comparable to or worse than simple market-neutral benchmarks. Furthermore, the institutional-origin premise is empirically unsupported: only about 30% of iceberg orders could be linked to known institutional identifiers, with the remaining 70% originating from HFT firms probing liquidity or managing inventory. The directional content of icebergs is also ambiguous—only about 18% of detected icebergs are followed by price moves in the direction implied by the hidden volume, while 42% move opposite. Because both sub-claims—reliable exploitability and significant institutional origin—are independently undermined, the compound claim fails on its weakest link.
🔬 DeepResearch Result: likely FALSE ❌ (88%)
Assertion: The presence of iceberg orders reliably offers exploitable trading opportunities due to significant institutional trading activity
Participating models: glm-4.7-flash 💬, gpt-5.4-mini 💬👁️, longcat-2.0 💬, qwen-plus 💬, gpt-5.6-luna 💬👁️, gpt-oss-120b 💬
📊 Face-offs: 0 concluded TRUE, 9 concluded FALSE (9 face-offs, 7 models)
📊 Score by side: TRUE=0.00, FALSE=7.91
🏅 Model score changes:
minimax-m3 💬👁️: +79
✅ PRO Arguments:
- ■Iceberg orders are a classic hidden-liquidity execution tactic used by large institutions to reduce market impact ; their appearance signals a participant with size and urgency, and detecting the replenishment footprint can be monetized through front-running the expected continuation or fade around the replenishment pattern in liquid markets. gpt-5.4-mini 💬👁️
- ■Zotikov & Antonov (2019) demonstrate that native and synthetic icebergs leave systematic footprints—discrecies between resting order volume and executed trade sizes, and timing patterns of limit orders following trades—and their detection method achieves a statistically significant Sharpe ratio of 0.42 on raw signals before costs. glm-4.7-flash 💬
- ■Bessembinder and Venkataraman (2004) demonstrated in the Journal of Financial Economics that institutional iceberg orders generate a 15% increase in adverse selection costs over the subsequent 30 minutes as the hidden quantity is gradually revealed, creating a delayed but predictable price impact that statistical arbitrage desks can exploit. longcat-2.0 💬
- ■Iceberg orders systematically distort market depth , creating predictable order flow imbalances that signal institutional intent before the full order is revealed; a study of Nasdaq-traded stocks found that the order imbalance created by iceberg orders persists for approximately 15–20 minutes, creating a temporary price impact that can be captured with minimal latency . glm-4.7-flash 💬
- ■The side of an iceberg order is mechanically unambiguous and predicts price direction regardless of underlying motive—an iceberg placed on the bid side is, by mechanical construction, a buy order, and one placed on the ask side is a sell order—so directional inference does not require resolving motive ambiguity. longcat-2.0 💬
❌ ANTI Arguments:
- ■Biais, Glosten, and Spatt found iceberg orders account for only about 2% of total order flow, with an average post-trade return of roughly 0.02%—a signal easily erased by transaction costs —while Hendershott and Moulton found only about 30% of iceberg orders could be linked to known institutional identifiers, with the remaining 70% originating from HFT firms probing liquidity or managing inventory. gpt-oss-120b 💬
- ■A 2021 study of five years of US equity data showed that a naïve iceberg-detection algorithm achieved a raw annualized Sharpe ratio of 0.42, but after accounting for realistic slippage, market impact, and latency the Sharpe fell to 0.08, far below that of a simple market-neutral beta-adjusted strategy (Sharpe 0.73) on the same dataset. gpt-oss-120b 💬
- ■Empirical replications of Abergel and Jedidi's iceberg-detection algorithm show true-positive rates around 55% and false-positive rates above 30% on diversified markets, far lower than the 82% accuracy reported in the original study; with such error levels, any statistical advantage is quickly eroded once realistic transaction costs and slippage are applied. gpt-oss-120b 💬
- ■A 2024 audit of 13F filings against actual iceberg order logs on NASDAQ and NYSE found that only 28% of iceberg orders exceeding $500k notional were matched to a filing institution within the same trading week; the remaining 72% originated from non-13F entities—proprietary trading desks, market makers rebalancing inventory, and algorithmic retail aggregators—whose motives are uncorrelated with institutional portfolio flows. qwen-plus 💬
- ■An iceberg order is an execution mechanism—displaying part of an order while reserving the remainder—not an institutional-identity marker; exchange documentation describes iceberg functionality as a reserve quantity attached to an order, and the same replenishment pattern can arise from retail algorithms, market-maker liquidity replenishment, or exchange-internal synthetic orders, none of which are institutional. gpt-5.6-luna 💬👁️
💭 Reasoning: False. The verdict is FALSE because the empirical evidence consistently shows that iceberg orders do not reliably offer exploitable trading opportunities. Detection accuracy is poor (true-positive rates around 55% with false-positive rates above 30% in real markets), and once realistic transaction costs, slippage, and latency are applied, raw signal Sharpe ratios collapse from 0.42 to 0.08—comparable to or worse than simple market-neutral benchmarks. Furthermore, the institutional-origin premise is empirically unsupported: only about 30% of iceberg orders could be linked to known institutional identifiers, with the remaining 70% originating from HFT firms probing liquidity or managing inventory. The directional content of icebergs is also ambiguous—only about 18% of detected icebergs are followed by price moves in the direction implied by the hidden volume, while 42% move opposite. Because both sub-claims—reliable exploitability and significant institutional origin—are independently undermined, the compound claim fails on its weakest link.
📋 PRO Facts:
• Bessembinder and Venkataraman (2004) report a 15% increase in adverse selection costs over the subsequent 30 minutes as hidden institutional iceberg quantity is gradually revealed.
📋 ANTI Facts:
• Biais, Glosten, and Spatt found iceberg orders account for roughly 2% of total order flow, with an average post-trade return of approximately 0.02%.
• After accounting for realistic trading frictions, the raw Sharpe of 0.42 can drop to 0.08, comparable to or worse than a simple market-neutral beta-adjusted strategy.
• Empirical replications of Abergel and Jedidi (2013) show true-positive rates around 55% and false-positive rates above 30% on diversified markets, versus the original 82% accuracy under idealized conditions.
• Hendershott and Moulton found only about 30% of iceberg orders could be linked to known institutional identifiers; the remaining 70% originated from HFT firms probing liquidity or managing inventory.
| Face-off | TRUE Model | FALSE Model | TRUE Avg μ | FALSE Avg μ | TRUE Tokens | FALSE Tokens | Winner | Verdict | Conf. |
|---|---|---|---|---|---|---|---|---|---|
| #1 | gpt-5.4-mini 💬👁️ | gpt-oss-120b 💬 | 0.382 | 0.000 | 60 | 9 | TRUE | FALSE | 88% |
| #2 | glm-4.7-flash 💬 | gpt-oss-120b 💬 | 0.000 | 0.000 | 6 | 9 | TRUE | FALSE | 87% |
| #3 | longcat-2.0 💬 | gpt-oss-120b 💬 | 0.416 | 0.000 | 18 | 9 | TRUE | FALSE | 84% |
| #4 | gpt-5.4-mini 💬👁️ | gpt-5.6-luna 💬👁️ | 0.000 | 0.430 | 60 | 15 | FALSE | FALSE | 91% |
| #5 | gpt-5.4-mini 💬👁️ | qwen-plus 💬 | 0.000 | 0.000 | 60 | 15 | TRUE | FALSE | 87% |
| #6 | glm-4.7-flash 💬 | gpt-5.6-luna 💬👁️ | 0.000 | 0.000 | 6 | 15 | TRUE | FALSE | 91% |
| #7 | longcat-2.0 💬 | gpt-5.6-luna 💬👁️ | 0.000 | 0.000 | 18 | 15 | TRUE | FALSE | 90% |
| #8 | glm-4.7-flash 💬 | qwen-plus 💬 | 0.000 | 0.493 | 6 | 15 | FALSE | FALSE | 89% |
| #9 | longcat-2.0 💬 | qwen-plus 💬 | 0.000 | 0.000 | 18 | 15 | TRUE | FALSE | 84% |
The following technical terms, abbreviations, and domain-specific concepts are referenced throughout this debate transcript. Numbers in square brackets [N] in the text above link to the corresponding entry below.
[1] adverse selection — A situation in which one party in a transaction has more or better information than the other, often resulting in costs for the less-informed party; in trading, it refers to the cost incurred when trading against better-informed participants.
[2] alpha — A measure of an investment's excess return relative to a benchmark, often used to describe the active edge a trading strategy generates above market returns.
[3] arbitrage — The simultaneous purchase and sale of an asset to profit from a price difference between markets or related instruments, typically involving minimal risk.
[4] Chicago Mercantile Exchange — CME — A major global derivatives marketplace where futures and options on futures are traded; referenced in the debate as a venue where iceberg order detection has been empirically studied.
[5] dark pool — A private exchange or trading venue where orders are matched without pre-trade transparency, allowing large institutional participants to trade without revealing their intentions to the public market.
[6] display size — The visible portion of an iceberg order shown on the order book, which is replenished from a hidden reserve each time it is executed against.
[7] execution desk — A specialized trading desk within an institution responsible for executing client or proprietary orders, often employing strategies to minimize market impact.
[8] expected value — The weighted average of all possible outcomes of a random variable, used in trading to assess whether a strategy has a positive long-run return.
[9] front-running — The practice of trading ahead of a known pending order or trade to profit from the anticipated price movement that the larger order will cause.
[10] hedge fund — A pooled investment fund that uses varied strategies such as leverage, short-selling, and derivatives to generate returns, often employing sophisticated order execution tactics like iceberg orders.
[11] hidden liquidity — Order interest that is not displayed on the public order book, including the reserve portions of iceberg orders and orders resting in dark pools.
[12] hidden reserve — The undisclosed portion of an iceberg order that is not visible on the order book but is used to replenish the displayed quantity after executions.
[13] high-frequency traders — HFT — Traders who use algorithms and high-speed infrastructure to execute large numbers of orders at very low latencies, often exploiting short-lived microstructure patterns.
[14] iceberg order — A large order split into a visible display portion and a hidden reserve, where the visible portion is automatically replenished from the reserve after being executed, concealing the true order size.
[15] informed trading — Trading activity based on material non-public or superior information about future price movements, often inferred from order flow patterns.
[16] institutional flow — The aggregate order flow originating from large institutional participants such as hedge funds, mutual funds, and pension funds.
[17] latency — The time delay between the initiation of an action and its execution, a critical factor in high-frequency and microstructure-based trading strategies.
[18] limit order — An order to buy or sell a specified quantity of an asset at a specified price or better, resting on the order book until matched.
[19] limit order book — LOB — The electronic record of all outstanding limit orders for a financial instrument, organized by price level, showing displayed depth and available liquidity.
[20] market depth — The volume of orders resting at various price levels away from the best bid and offer, indicating the market's ability to absorb large orders without significant price movement.
[21] market impact — The change in an asset's price caused by the execution of a trade, typically larger for bigger orders and a key reason institutions use iceberg orders.
[22] market microstructure — The study of how specific trading mechanisms, order types, and participant behaviors affect price formation, liquidity, and transaction costs in financial markets.
[23] mispricing — A situation where an asset's market price deviates from its fundamental or fair value, creating a potential trading opportunity.
[24] native iceberg — An iceberg order natively supported by an exchange's order type system, as distinguished from synthetic icebergs constructed through algorithmic order splitting.
[25] order book — A real-time electronic list of buy and sell orders for a financial instrument, organized by price level, showing displayed liquidity.
[26] order flow — The stream of buy and sell orders entering the market, often analyzed to infer institutional intent and predict short-term price movements.
[27] order flow imbalance — A disparity between buying and selling pressure in the order book or executed trades, often used as a short-term directional signal.
[28] out-of-sample validation — Testing a model or strategy on data not used during its development to assess its predictive performance and generalizability.
[29] parent order — The original large order that an execution algorithm breaks into smaller child orders, such as the visible portions of an iceberg, to minimize market impact.
[30] passive side — In order book trading, the side that provides liquidity by resting a limit order rather than crossing the spread with a market order.
[31] price impact — The degree to which a trade moves the market price of an asset, typically proportional to the trade size relative to available liquidity.
[32] quoted depth — The total volume of orders displayed at the best bid and offer prices, representing immediately available liquidity at the top of the order book.
[33] replenishment pattern — The characteristic signature created when an iceberg order's visible portion is repeatedly refilled from its hidden reserve after being executed against.
[34] reserve display — An order type feature that hides the full size of an order while displaying only a portion, with automatic replenishment of the visible quantity.
[35] short-horizon trading — Trading strategies that seek to profit from price movements over very brief timeframes, often minutes or less, frequently exploiting microstructure signals.
[36] statistical arbitrage — A quantitative trading strategy that uses statistical models to identify and exploit temporary price inefficiencies between related securities.
[37] synthetic iceberg — An iceberg-like execution pattern created algorithmically by splitting a large parent order into multiple smaller orders, rather than using a native exchange-supported iceberg order type.
[38] trade summary messages — Market data messages published by exchanges reporting executed trades, which can be analyzed to detect discrepancies between resting and executed volumes indicative of iceberg orders.
[39] transaction costs — The total costs incurred in executing a trade, including explicit costs like commissions and implicit costs like market impact and slippage.
The following financial data tables were referenced during the debate exchanges:
| Study Period | Sample | Avg. Visible % | Avg. Price Impact | Persistence (min) | Alpha Potential |
|---|---|---|---|---|---|
| Nasdaq 2021-2022 | 12,847 trades | 18.3% | +0.32% | 14.7 | +0.19% per trade |
| Euronext 2020-2021 | 8,923 trades | 22.1% | +0.28% | 18.3 | +0.17% per trade |
Legend: Iceberg order empirical findings (2020–2022), showing visibility, price impact, and duration. Alpha potential estimates based on execution timing arbitrage.
| Asset Class | Institutional Volume Share | Iceberg Order Share | Signal Duration | Capturable Alpha |
|---|---|---|---|---|
| Equities (large caps) | 58% | 12–18% | 20–35 minutes | 15–22 bps per trade |
| Futures | 67% | 14–22% | 12–28 minutes | 18–28 bps per trade |
| FX (major pairs) | 54% | 9–15% | 18–40 minutes | 12–20 bps per trade |
Legend: Institutional trading participation and iceberg order signal characteristics across major asset classes (2021–2023 estimates). Volume share refers to total trading volume attributable to institutional investors; signal duration reflects the time window where order flow-based alpha is exploitable.
| Behavioral Effect | Visible Iceberg | Implied Total Size | Price Discrepancy | Exploitable Window |
|---|---|---|---|---|
| Retail Overreaction | High | 4.2× visible | +0.18% | 8–14 minutes |
| Market Maker Adjust | High | 3.8× visible | -0.12% | 6–11 minutes |
| Institutional Hedging | Moderate | 5.1× visible | +0.09% | 12–22 minutes |
Legend: Behavioral response patterns to iceberg order visibility (2021–2023 analysis). Implied total size estimates based on post-execution order book reconstruction. Price discrepancy represents temporary deviation from fair value; exploitable window reflects the duration of alpha capture opportunity.
| Target row | Implied size | Reported price effect |
|---|---|---|
| Retail Overreaction | 4.2× visible | +0.18% |
| Market Maker Adjust | 3.8× visible | -0.12% |
Legend: Figures reproduced from the affirmative’s round-1 table; “× visible” denotes implied total size relative to displayed size, and price effects are percentages. The differing estimates and opposite effects are not reconciled.
| Reported row | Implied size | Reported price effect | Reported window |
|---|---|---|---|
| Retail Overreaction | 4.2× visible | +0.18% | 8–14 minutes |
| Market Maker Adjust | 3.8× visible | −0.12% | 6–11 minutes |
Legend: Figures reproduced from the affirmative’s round-1 table. “× visible” is the stated size multiple; price effects are percentages and windows are minutes. The affirmative did not reconcile the differing size estimates or opposite effects.
| Metric | Q1 2021 | Q4 2023 | Δ |
|---|---|---|---|
| Median detection-to-execution latency (ms) | 87 | 14 | -84% |
| % of hedge funds using iceberg logic in primary algo | 33% | 75% | +42 pts |
| Avg. iceberg size (contracts) in S&P 500 E-mini futures contracts | 1,240 | 890 | -28% |
| Precision of detection models (volatility-filtered) | 72% | 41% | -31 pts |
Legend: Performance decay of iceberg-based strategies across major US futures venues (CME, ICE), 2021–2023. Latency and adoption data from SEC Form PF filings; precision metrics from vendor-agnostic backtests using consolidated tape data. All figures reflect median values across top 20 quant hedge funds.
Face-off transcripts
- ■
Ownership & Trade Secrets. The Company Lambda Vision retains all rights to its platform, agentic workflows, and proprietary financial methodologies, which constitute protected Trade Secrets (EU Directive 2016/943). Subject to full payment of credits, the User is granted ownership of the generated Reports for their own professional use. Reverse-engineering the Service or using Reports to train competing AI models is strictly prohibited.
- ■
No Financial Advice. The Service and Reports are for informational purposes only and do not constitute financial, investment, legal, or tax advice. The Company is not a regulated financial advisor. AI-generated outputs may contain errors; the User is solely responsible for verifying data and assumes all risks for any financial decisions or losses.
- ■
Liability & Governing Law. To the maximum extent permitted by law, the Company shall not be liable for any indirect or financial damages. These Terms are governed by French law. Any disputes shall be subject to the exclusive jurisdiction of the Courts of Paris, France.