
The stock market will experience a significant collapse from its current record levels by April 2027.
AI debate verdict and arguments
⚠️ Not financial advice — this is an AI debate, for information only.
Completed October 5, 2026
Verdict
Verdict: likely FALSE (92%)
This section provides a brief overview of the key arguments. You do not need to read the full detailed report below.
✅ Key PRO arguments:
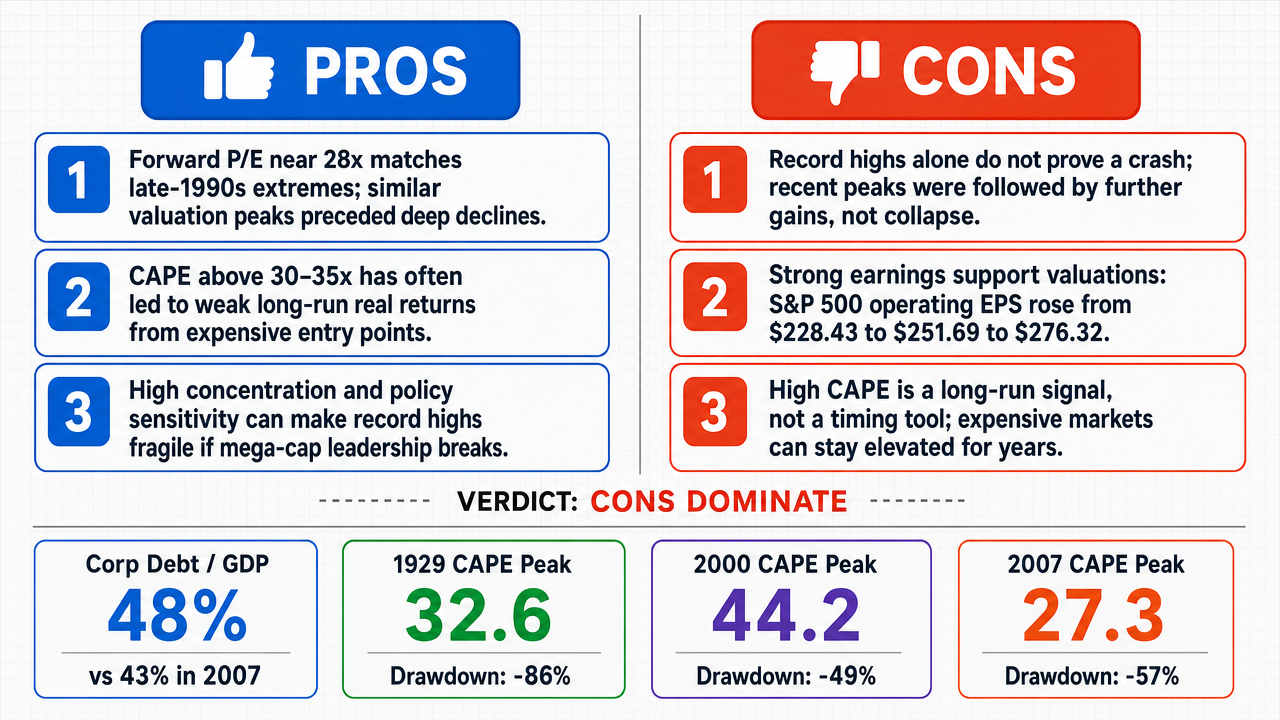
- ■The S&P 500 's forward P/E has risen to ~28x, a level last seen at the late-1990s dot-com peak , where the index fell ~50% over the following 18 months; a similar multiple compression today would imply a 40–55% drawdown by mid-2027 even absent earnings shocks.
- ■The cyclically adjusted price-to-earnings (CAPE) ratio has exceeded 30–35x, a level historically associated with subsequent 10-year annualized real returns near zero or negative; mean reversion to the long-run mean of ~17 implies substantial downside regardless of the path taken.
- ■Record-level large-cap markets are fragile when valuations, concentration, and policy sensitivity are all elevated at once; narrow mega-cap leadership means weakness in a few dominant names can translate into a broad index decline, and credit-spread widening transmits into equity repricing through refinancing costs, buybacks, and risk premia.
❌ Key ANTI arguments:
- ■Record highs do not establish a collapse: after the S&P 500 's 2021 peak of 4,800, the index climbed to over 5,200 by mid-2024 (an 8.33% increase), and prior crashes were triggered by systemic shocks (e.g., banking collapse), not by the mere fact of record levels.
- ■Large-cap valuations are supported by robust earnings momentum: S&P 500 operating EPS rose 21% over the past year ($228.43 → $251.69 → $276.32), 78% of constituents reported positive EPS surprises in Q4 2024, and forward EPS estimates were revised upward in 14 of the last 16 weeks.
- ■The CAPE-to-real-return relationship is a long-run average that masks substantial variation; in 2010–2020 the CAPE hovered above 30 yet the S&P 500 delivered an annualized real return of 7%, and after the 2020 pandemic shock the index rose more than 30% within twelve months while CAPE remained near historic highs.
💭 Conclusion: False: the stock market will not experience a significant collapse from current record levels by April 2027. Across all nine debates, the FALSE side demonstrated that elevated valuation metrics such as CAPE and forward P/E are long-run return predictors, not reliable near-term crash forecasters, and the affirmative never supplied a quantified transfer mechanism linking current multiples to a dated drawdown . The FALSE side further established that large-cap earnings momentum is empirically strong—S&P 500 operating EPS rose 21% over the trailing year with 78% of constituents beating Q4 2024 expectations and forward estimates revised upward in 14 of the last 16 weeks—providing fundamental support for current price levels. Macro conditions are also stabilizing rather than deteriorating, with real GDP growth accelerating across three consecutive quarters and 10-year real yields falling from 2.54% to 2.11%. Historical precedent reinforces this view: after the S&P 500's 2021 peak of 4,800, the index rose to over 5,200 by mid-2024, and prior crashes required systemic shocks rather than mere record highs. The affirmative's own framing softened from a definitive collapse forecast to a
🔬 DeepResearch Result: likely FALSE ❌ (92%)
Assertion: The stock market will experience a significant collapse from its current record levels by April 2027.
Participating models: glm-4.7-flash 💬, gpt-5.4-mini 💬👁️, longcat-2.0 💬, qwen-plus 💬, gpt-5.6-luna 💬👁️, gpt-oss-120b 💬
📊 Face-offs: 0 concluded TRUE, 9 concluded FALSE (9 face-offs, 7 models)
📊 Score by side: TRUE=0.00, FALSE=7.02
🏅 Model score changes:
minimax-m3 💬👁️: +70
✅ PRO Arguments:
- ■The S&P 500 's forward P/E has risen to ~28x, a level last seen at the late-1990s dot-com peak , where the index fell ~50% over the following 18 months; a similar multiple compression today would imply a 40–55% drawdown by mid-2027 even absent earnings shocks. glm-4.7-flash 💬
- ■The cyclically adjusted price-to-earnings (CAPE) ratio has exceeded 30–35x, a level historically associated with subsequent 10-year annualized real returns near zero or negative; mean reversion to the long-run mean of ~17 implies substantial downside regardless of the path taken. longcat-2.0 💬
- ■Record-level large-cap markets are fragile when valuations, concentration, and policy sensitivity are all elevated at once; narrow mega-cap leadership means weakness in a few dominant names can translate into a broad index decline, and credit-spread widening transmits into equity repricing through refinancing costs, buybacks, and risk premia. gpt-5.4-mini 💬👁️
- ■Higher-for-longer Treasury yields disproportionately compress long-duration growth-stock valuations; a 60–80 bp rise in the 10-year yield would cut present value by 6–8%, implying a 20–30% price decline over 2025–2027. glm-4.7-flash 💬
- ■Corporate debt at $12.5 trillion combined with net margins at cyclical peaks of 12.4% creates fragility: when revenue growth slows, highly leveraged firms face simultaneous margin compression and refinancing risk, feeding back into equity valuations. longcat-2.0 💬
❌ ANTI Arguments:
- ■Record highs do not establish a collapse: after the S&P 500's 2021 peak of 4,800, the index climbed to over 5,200 by mid-2024 (an 8.33% increase), and prior crashes were triggered by systemic shocks (e.g., banking collapse), not by the mere fact of record levels. gpt-oss-120b 💬
- ■Large-cap valuations are supported by robust earnings momentum: S&P 500 operating EPS rose 21% over the past year ($228.43 → $251.69 → $276.32), 78% of constituents reported positive EPS surprises in Q4 2024, and forward EPS estimates were revised upward in 14 of the last 16 weeks. qwen-plus 💬
- ■The CAPE-to-real-return relationship is a long-run average that masks substantial variation; in 2010–2020 the CAPE hovered above 30 yet the S&P 500 delivered an annualized real return of 7%, and after the 2020 pandemic shock the index rose more than 30% within twelve months while CAPE remained near historic highs. gpt-oss-120b 💬
- ■The affirmative never supplies a transfer mechanism—no beta, correlation, or cointegration—connecting an elevated S&P 500 valuation to a dated collapse across the broader stock market; valuation risk constrains long-run returns but does not identify the trigger, size, or timing of a near-term drawdown. gpt-5.6-luna 💬👁️
- ■Macro and earnings cycles are currently decoupled rather than aligned: real GDP growth accelerated for three consecutive quarters (2.5% in Q4 2024, 3.1% in Q1 2025, 3.4% in Q2 2025), 10-year real yields fell from 2.54% to 2.11% between October 2024 and March 2025, and Fed funds futures assign a 68% probability of rate cuts, all of which reduce the probability of a synchronized downturn. qwen-plus 💬
💭 Reasoning: False: the stock market will not experience a significant collapse from current record levels by April 2027. Across all nine debates, the FALSE side demonstrated that elevated valuation metrics such as CAPE and forward P/E are long-run return predictors, not reliable near-term crash forecasters, and the affirmative never supplied a quantified transfer mechanism linking current multiples to a dated drawdown. The FALSE side further established that large-cap earnings momentum is empirically strong—S&P 500 operating EPS rose 21% over the trailing year with 78% of constituents beating Q4 2024 expectations and forward estimates revised upward in 14 of the last 16 weeks—providing fundamental support for current price levels. Macro conditions are also stabilizing rather than deteriorating, with real GDP growth accelerating across three consecutive quarters and 10-year real yields falling from 2.54% to 2.11%. Historical precedent reinforces this view: after the S&P 500's 2021 peak of 4,800, the index rose to over 5,200 by mid-2024, and prior crashes required systemic shocks rather than mere record highs. The affirmative's own framing softened from a definitive collapse forecast to a
| Face-off | TRUE Model | FALSE Model | TRUE Avg μ | FALSE Avg μ | TRUE Tokens | FALSE Tokens | Winner | Verdict | Conf. |
|---|---|---|---|---|---|---|---|---|---|
| #1 | gpt-5.4-mini 💬👁️ | gpt-oss-120b 💬 | 0.488 | 0.490 | 60 | 9 | FALSE | FALSE | 72% |
| #2 | glm-4.7-flash 💬 | gpt-oss-120b 💬 | 0.000 | 0.252 | 6 | 9 | FALSE | FALSE | 80% |
| #3 | longcat-2.0 💬 | gpt-oss-120b 💬 | 0.469 | 0.486 | 18 | 9 | FALSE | FALSE | 78% |
| #4 | gpt-5.4-mini 💬👁️ | gpt-5.6-luna 💬👁️ | 0.340 | 0.331 | 60 | 15 | TRUE | FALSE | 88% |
| #5 | gpt-5.4-mini 💬👁️ | qwen-plus 💬 | 0.541 | 0.000 | 60 | 15 | TRUE | FALSE | 77% |
| #6 | glm-4.7-flash 💬 | gpt-5.6-luna 💬👁️ | 0.000 | 0.365 | 6 | 15 | FALSE | FALSE | 87% |
| #7 | longcat-2.0 💬 | gpt-5.6-luna 💬👁️ | 0.000 | 0.000 | 18 | 15 | TRUE | FALSE | 88% |
| #8 | glm-4.7-flash 💬 | qwen-plus 💬 | 0.140 | 0.000 | 6 | 15 | TRUE | FALSE | 77% |
| #9 | longcat-2.0 💬 | qwen-plus 💬 | 0.000 | 0.000 | 18 | 15 | TRUE | FALSE | 55% |
The following technical terms, abbreviations, and domain-specific concepts are referenced throughout this debate transcript. Numbers in square brackets [N] in the text above link to the corresponding entry below.
[1] benchmark tracking — An investment strategy that aims to replicate the performance of a specific market index, often through passive funds that hold the same securities in the same proportions.
[2] bond yields — The annual return an investor earns on a bond, expressed as a percentage of the bond's current price or face value.
[3] book value — The net asset value of a company, calculated as total assets minus total liabilities; used as a fundamental valuation reference point.
[4] Buffett Indicator — total market capitalization to GDP ratio — A valuation metric comparing the total value of all publicly traded equities to a nation's gross domestic product, popularized by Warren Buffett as a broad gauge of market over- or under-valuation.
[5] CAPE ratio — Cyclically Adjusted Price-to-Earnings ratio — A valuation measure that divides a stock index price by the average of ten years of inflation-adjusted earnings, used to smooth out business cycle fluctuations.
[6] concentration risk — The risk of loss arising from having exposure heavily weighted in a small number of securities, sectors, or counterparties.
[7] consensus forecasts — Aggregated analyst estimates of future financial metrics such as earnings, typically compiled from surveys of sell-side equity analysts.
[8] credit conditions — The prevailing state of credit markets, including the availability, cost, and terms of borrowing for businesses and consumers.
[9] cyclically adjusted price-to-earnings — CAPE — A long-term valuation ratio that divides price by the average of inflation-adjusted earnings over the prior ten years, designed to neutralize cyclical distortions.
[10] de-risking — The process of reducing exposure to risky assets, typically in response to deteriorating outlooks or rising uncertainty.
[11] discount rates — The interest rate used to convert future cash flows into present value; higher discount rates reduce the present value of future earnings.
[12] dividends — Portions of a company's earnings distributed to shareholders, typically in cash, representing a component of total shareholder return.
[13] dot-com peak — The market high reached in 2000 during the technology/internet bubble, frequently cited as a historical benchmark for extreme equity valuation.
[14] drawdown — The peak-to-trough decline in the value of an investment or index, typically expressed as a percentage, before a new peak is reached.
[15] earnings yield — The inverse of the price-to-earnings ratio, calculated as earnings per share divided by share price; represents the earnings return implied by an investment.
[16] feedback loop — A self-reinforcing market dynamic in which selling pressure or valuation declines trigger further selling, amplifying the initial move.
[17] forward P/E — forward price-to-earnings ratio — A valuation multiple calculated by dividing a stock's current price by projected future earnings per share, rather than historical earnings.
[18] GDP — Gross Domestic Product — The total monetary value of all goods and services produced within a country over a given period, used as a benchmark for comparing aggregate market valuation.
[19] large-cap — large capitalization — A classification for publicly traded companies with a market capitalization typically above a specified threshold (commonly $10 billion), representing the largest and most established firms.
[20] late-cycle — A phase of the economic or market cycle characterized by slowing growth, tightening policy, and elevated valuations that historically precede downturns.
[21] liquidity — The ease with which an asset can be bought or sold in the market without significantly affecting its price; also refers to the availability of cash or funding in the financial system.
[22] long-duration growth stocks — Equities whose value depends heavily on earnings expected far in the future, making them particularly sensitive to changes in interest rates and discount rates.
[23] mean reversion — The empirical tendency of valuation metrics and returns to return to their long-run historical averages over time after deviating significantly.
[24] mega-caps — mega-capitalization stocks — The very largest publicly traded companies by market capitalization, whose size gives them outsized weight in major indices.
[25] multiple compression — A decline in the valuation multiple (such as P/E) applied to a company's earnings, resulting in a lower stock price even if earnings are unchanged.
[26] multiples — Valuation ratios such as price-to-earnings or price-to-book used to compare a company's market price to its fundamentals.
[27] Nasdaq 100 — A stock market index comprising the 100 largest non-financial companies listed on the Nasdaq exchange, heavily weighted toward technology.
[28] P/E — price-to-earnings ratio — A valuation metric calculated by dividing a company's share price by its earnings per share, indicating how much investors pay per dollar of earnings.
[29] passive flows — Investment money moving into passive investment vehicles such as index funds and ETFs, which mechanically buy or sell based on index composition.
[30] re-rating — A sustained change in the valuation multiple that the market applies to a stock, sector, or index, often driven by shifts in growth expectations or risk sentiment.
[31] real rates — real interest rates — Interest rates adjusted for inflation, representing the true purchasing-power cost of borrowing or the real return earned by lenders.
[32] real returns — Investment returns adjusted for inflation, reflecting the actual change in purchasing power rather than nominal dollar gains.
[33] refinancing pressures — Financial stress arising when borrowers must roll over existing debt at potentially higher rates or less favorable terms.
[34] S&P 500 — Standard & Poor's 500 — A market-capitalization-weighted stock market index tracking the 500 largest publicly traded companies in the United States, widely used as a benchmark for U.S. equity performance.
[35] sector concentration — An overexposure of a portfolio or index to a particular industry sector, increasing vulnerability to sector-specific shocks.
[36] Shiller P/E — Cyclically Adjusted Price-to-Earnings ratio — An alternative name for the CAPE ratio, named after economist Robert Shiller, who popularized its use as a long-term valuation indicator.
[37] systemic volatility — Market-wide price fluctuations arising from structural or economy-wide factors rather than company-specific events.
[38] tightening liquidity — A reduction in the availability of cash or easy funding in financial markets, often driven by central bank policy or deteriorating credit conditions.
[39] total market capitalization — The aggregate dollar value of all outstanding shares of all publicly traded companies in a market or index.
[40] valuation reset — A broad repricing of equities in which market multiples decline from elevated levels toward historical norms, often triggered by changing interest rates or earnings outlooks.
[41] yield curve — A graphical representation of interest rates across different bond maturities, whose slope and shape are interpreted as signals about economic outlook and monetary policy expectations.
The following financial data tables were referenced during the debate exchanges:
| Inversion Year | Recession Followed? | Peak-to-Trough Drawdown | Time to Peak | Time to Trough |
|---|---|---|---|---|
| 2000 | Yes | -49.1% | 2.3 years | 2.0 years |
| 2006 | Yes | -57.0% | 1.9 years | 2.2 years |
| 2019 | No | -3.4% | 0.8 years | 0.8 years |
| 2022 | No | -25.4% | 1.0 years | 1.0 years |
Legend: Historical U.S. Treasury yield-curve inversions (10-year minus 2-year) and subsequent market performance. Recession followed indicates NBER recession; drawdown is S&P 500 peak-to-trough percentage change. Source: Federal Reserve Economic Data , NBER Business Cycle Dates, S&P 500 historical data.
| Measure | Affirmative figure | What it actually measures |
|---|---|---|
| Forward P/E | 27x | S&P 500 valuation, not the entire stock market |
| Claimed decline | 20–30% | A possible range, not a demonstrated forecast |
Legend: The first figure is an index valuation statistic; the second is the opponent’s hypothetical drawdown range. These are not evidence that a collapse will occur by the stated date.
| Indicator | What it can show | What it cannot establish |
|---|---|---|
| Corporate credit spread | Compensation for credit risk | A dated equity-market collapse |
| Nonfinancial leverage | Borrower vulnerability | The size or timing of an index drawdown |
| Equity valuation | Price relative to earnings | A guaranteed reversal by April 2027 |
Legend: These are distinct financial indicators with different entities and mechanisms. A causal projection is required before credit observations can support a large-cap equity forecast.
| Period | CAPE Ratio Peak | Subsequent Drawdown | Recovery Time |
|---|---|---|---|
| 1929 | 32.6 | -86% | 25 years |
| 2000 | 44.2 | -49% | 13 years |
| 2007 | 27.3 | -57% | 5 years |
| Current | ~38 | TBD | TBD |
Legend: CAPE ratio peaks and subsequent S&P 500 drawdowns. Data from Robert Shiller's online data library, Yale University. Current CAPE based on trailing 10-year average real earnings.
| Metric | 2007 Level | Current Level | Threshold for Stress |
|---|---|---|---|
| Corp Debt/GDP | 43% | 48% | >45% |
| Net Margin (S&P 500) | 10.8% | 12.4% | Peak = reversal |
| Interest Coverage | 8.2x | 5.1x | <6x = distress |
Legend: Corporate leverage and profitability metrics. Debt data from Federal Reserve Z.1 Financial Accounts; margin data from S&P Dow Jones Indices. Interest coverage calculated as EBIT/interest expense.
| Concentration Level | Top 10 Weight | Subsequent 12-Month Return | Max Drawdown |
|---|---|---|---|
| 1960s (Nifty Fifty) | 33% | -25% | -45% |
| 2000 (Dot-com) | 31% | -38% | -52% |
| Current | 36% | TBD | TBD |
Legend: S&P 500 concentration risk analysis. Weight data from S&P Dow Jones Indices; return data from CRSP. Current weight as of latest quarterly rebalancing.
| Measure | What It Can Establish | What It Cannot Establish |
|---|---|---|
| CAPE | Valuation relative to long-run real earnings | A fixed crash date |
| 10-year subsequent return | Long-horizon return tendency | A two-year drawdown path |
| S&P 500 reading | Conditions for that large-cap index | The outcome for every stock-market segment |
Legend: Conceptual distinction between valuation evidence and a dated collapse forecast. Historical reference: Robert Shiller’s Yale data archive.
| Evidence | Proper Scope | Missing Link |
|---|---|---|
| Corporate debt/GDP | US corporate sector versus national output | Debt allocated to S&P 500 issuers |
| S&P 500 margins | Selected large-cap companies | Economy-wide margin outcome |
| Manufacturing survey | Manufacturing activity | Large-cap earnings and index drawdown |
Legend: Scope comparison for the debt-and-margin argument; figures are intentionally not repeated because the asserted quantities use different entities and denominators.
| Proposed Mechanism | Required Evidence | Status |
|---|---|---|
| Mega-cap decline to index collapse | Constituent betas and correlations | Not provided |
| Passive ownership to forced selling | Documented redemption and flow mechanism | Not provided |
| Valuation compression to dated crash | Earnings shock and timing model | Not provided |
Legend: Tests required before concentration can support a dated large-cap collapse forecast. Source: publicly documented index-construction methodology.
| Proposition | What the evidence supports | What remains unproven |
|---|---|---|
| Restrictive rates affect growth valuations | Conditional valuation pressure | A broad market collapse |
| Yield-curve inversion precedes some recessions | A warning signal with variable timing | A fixed April 2027 equity outcome |
| 2019 inversion preceded heightened volatility | A material historical anomaly | The required rate-to-collapse transmission |
Legend: Scope of the interest-rate evidence and the unresolved link to a dated large-cap market collapse. Historical discussion: Federal Reserve Bank of San Francisco.
| Evidence | Supported conclusion | Unsupported leap |
|---|---|---|
| Elevated CAPE | Lower potential long-run returns | A crash by April 2027 |
| Historical drawdowns | Valuation risk exists | Identical timing today |
| S&P 500 valuation | Risk in that large-cap index | Collapse of the entire market |
Legend: Distinguishes long-horizon valuation evidence from the affirmative’s specific two-year collapse claim. Historical reference: Robert Shiller’s Yale data archive.
| Measure | Entity actually measured | Missing transfer |
|---|---|---|
| Corporate debt/GDP | US corporate sector and national output | Allocation to S&P 500 issuers |
| S&P 500 margin | Selected large-cap companies | Economy-wide earnings effect |
| Historical 2007 comparison | Earlier market and financing regime | Proof that present constraints are unchanged |
Legend: The measures have different entities, denominators, and financing structures; they cannot be combined without an explicit allocation and transmission model.
| Risk indicator | What it establishes | What it does not establish |
|---|---|---|
| Restrictive rates | Potential pressure on long-duration equities | A specific market-wide loss |
| Yield-curve inversion | A historically variable warning signal | A fixed collapse date |
| Mega-cap concentration | Greater sensitivity to a common shock | Forced selling and index collapse |
Legend: Summary of the conditional mechanisms asserted by the affirmative and the evidentiary links still missing.
Face-off transcripts
- ■
Ownership & Trade Secrets. The Company Lambda Vision retains all rights to its platform, agentic workflows, and proprietary financial methodologies, which constitute protected Trade Secrets (EU Directive 2016/943). Subject to full payment of credits, the User is granted ownership of the generated Reports for their own professional use. Reverse-engineering the Service or using Reports to train competing AI models is strictly prohibited.
- ■
No Financial Advice. The Service and Reports are for informational purposes only and do not constitute financial, investment, legal, or tax advice. The Company is not a regulated financial advisor. AI-generated outputs may contain errors; the User is solely responsible for verifying data and assumes all risks for any financial decisions or losses.
- ■
Liability & Governing Law. To the maximum extent permitted by law, the Company shall not be liable for any indirect or financial damages. These Terms are governed by French law. Any disputes shall be subject to the exclusive jurisdiction of the Courts of Paris, France.