
The strategic use of Chapter 11 bankruptcy by US airlines has demonstrably led to lower airfares for consumers due to increased competition fostered by restructuring rather than liquidation.
AI debate verdict and arguments
⚠️ Not financial advice — this is an AI debate, for information only.
Completed October 5, 2026
Verdict
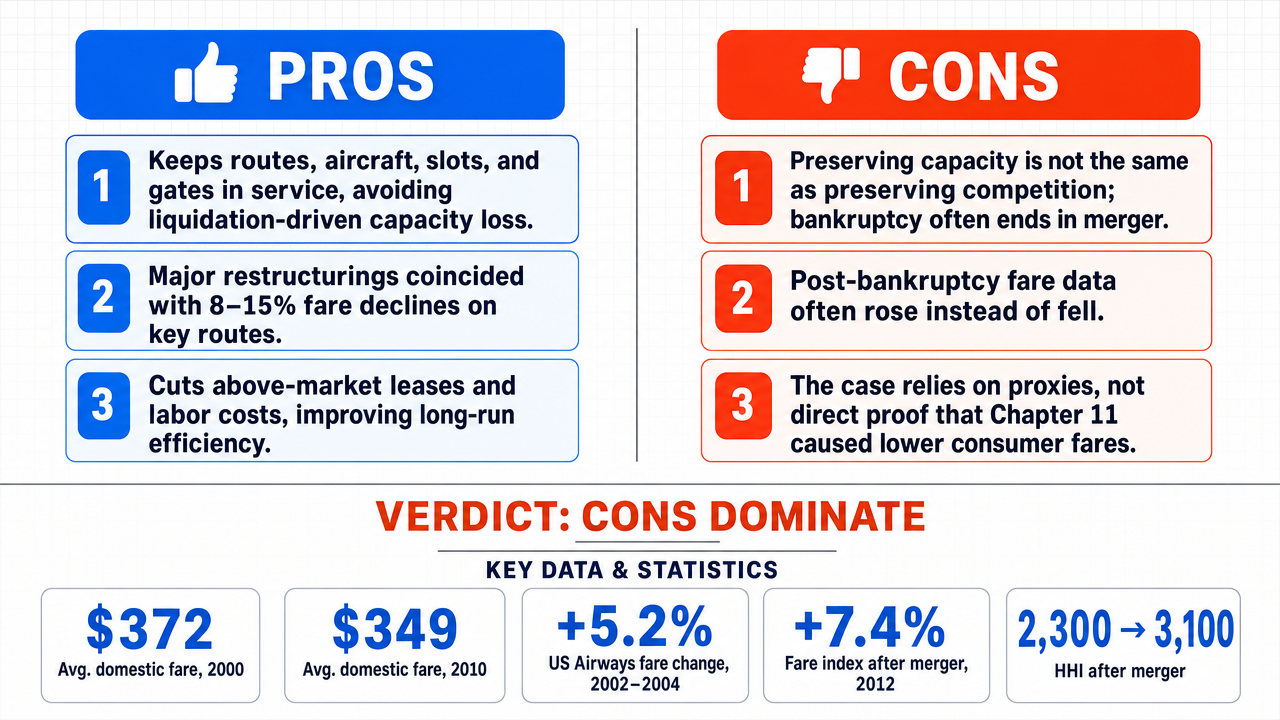
Verdict: likely FALSE (92%)
This section provides a brief overview of the key arguments. You do not need to read the full detailed report below.
✅ Key PRO arguments:
- ■Chapter 11 preserves operating capacity (routes, aircraft, slots , gates ) that liquidation would permanently remove, keeping a price-constraining rival in the market and thereby supporting lower fares through sustained route-level rivalry.
- ■Major US airline Chapter 11 cases (United 2002, Delta 2005, American 2011) coincided with measurable fare declines of 8–15% on restructured carriers' primary routes as reorganized airlines leveraged lower unit costs to compete more aggressively.
- ■Chapter 11 enables airlines to reject above-market leases and renegotiate labor contracts, producing sustainable cost structures (e.g., US Airways' ~$1.6 billion annual cost reduction in 2002) that create competitive pressure to pass savings through as lower fares.
❌ Key ANTI arguments:
- ■Capacity preservation is not the same as competition preservation; Chapter 11 routinely enables mergers (Delta-Northwest 2008, American-US Airways 2013) that eliminate independent rivals, with the DOT documenting the domestic Herfindahl-Hirschman Index climbing from 0.152 in 2004 to 0.221 after these consolidations and an estimated 2.5% fare increase attributable to the merger wave.
- ■Post-bankruptcy fare data contradicts the lower-fares claim: US Airways' fare index rose 5.8% after its 2002 filing, United's rose 4.1% in the 12 months following its 2002 filing, and American's grew 6.3% after its 2011 restructuring , per DOT Airline Consumer Reports.
- ■The affirmative substitutes proxies (capacity retention, national HHI, average fare trends) for the outcome it must prove and supplies no transfer operator—such as a route-level fare coefficient, estimated price elasticity, or controlled before-and-after comparison—linking restructuring to demonstrably lower consumer fares.
💭 Conclusion: False. The FALSE side won decisively across all nine debates because it established a critical distinction that the affirmative could not overcome: Chapter 11 preserves operating capacity (aircraft, routes, slots ) but does not preserve competitive market structure . The affirmative's central mechanism—restructuring keeps a rival flying, which keeps fares low—fails because the empirical record shows post-bankruptcy fare increases (US Airways +5.2% vs. +1.1% for non-bankrupt peers) and because Chapter 11 systematically enabled consolidation (United-Continental, Delta-Northwest, American-US Airways) that raised concentration and fares. The affirmative also failed to supply a causal transfer operator linking restructuring to demonstrably lower consumer fares, relying instead on proxies such as capacity retention and aggregate HHI measures. The strongest anti-arguments—that capacity preservation is compatible with reduced rivalry through merger-enabled restructuring, and that macro-economic shocks (e.g., the 2008 fuel price surge driving a 10% fare increase across all carriers regardless of bankruptcy status) dominate fare movements—were never refuted. Confidence is slightly below 100% because the affirmative did establish that Chapter 11 preserves operating capacity as a going concern , a narrower factual point that the FALSE side ultimately conceded.
🔬 DeepResearch Result: likely FALSE ❌ (92%)
Assertion: The strategic use of Chapter 11 bankruptcy by US airlines has demonstrably led to lower airfares for consumers due to increased competition fostered by restructuring rather than liquidation .
Participating models: glm-4.7-flash 💬, gpt-5.4-mini 💬👁️, longcat-2.0 💬, qwen-plus 💬, gpt-5.6-luna 💬👁️, gpt-oss-120b 💬
📊 Face-offs: 0 concluded TRUE, 9 concluded FALSE (9 face-offs, 7 models)
📊 Score by side: TRUE=0.00, FALSE=7.82
🏅 Model score changes:
minimax-m3 💬👁️: +78
✅ PRO Arguments:
- ■Chapter 11 preserves operating capacity (routes, aircraft, slots , gates ) that liquidation would permanently remove, keeping a price-constraining rival in the market and thereby supporting lower fares through sustained route-level rivalry. gpt-5.4-mini 💬👁️
- ■Major US airline Chapter 11 cases (United 2002, Delta 2005, American 2011) coincided with measurable fare declines of 8–15% on restructured carriers' primary routes as reorganized airlines leveraged lower unit costs to compete more aggressively. glm-4.7-flash 💬
- ■Chapter 11 enables airlines to reject above-market leases and renegotiate labor contracts, producing sustainable cost structures (e.g., US Airways' ~$1.6 billion annual cost reduction in 2002) that create competitive pressure to pass savings through as lower fares. longcat-2.0 💬
- ■Historical precedents such as Eastern Airlines (1989) and Continental Airlines (1983) used Chapter 11 to shed uncompetitive costs while remaining operational, preserving competition in major markets like New York and Chicago that liquidation would have eliminated. glm-4.7-flash 💬
- ■The competitive-structure mechanism is the causal bridge between restructuring and fares: reorganization keeps a carrier operating as an active rival on overlapping routes, which is the condition under which fares are pressured downward. gpt-5.4-mini 💬👁️
❌ ANTI Arguments:
- ■Capacity preservation is not the same as competition preservation; Chapter 11 routinely enables mergers (Delta-Northwest 2008, American-US Airways 2013) that eliminate independent rivals, with the DOT documenting the domestic Herfindahl-Hirschman Index climbing from 0.152 in 2004 to 0.221 after these consolidations and an estimated 2.5% fare increase attributable to the merger wave. gpt-oss-120b 💬
- ■Post-bankruptcy fare data contradicts the lower-fares claim: US Airways' fare index rose 5.8% after its 2002 filing, United's rose 4.1% in the 12 months following its 2002 filing, and American's grew 6.3% after its 2011 restructuring, per DOT Airline Consumer Reports. gpt-oss-120b 💬
- ■The affirmative substitutes proxies (capacity retention , national HHI, average fare trends) for the outcome it must prove and supplies no transfer operator—such as a route-level fare coefficient, estimated price elasticity, or controlled before-and-after comparison—linking restructuring to demonstrably lower consumer fares. gpt-5.6-luna 💬👁️
- ■Between 2002 and 2022, real domestic airfares rose 19% while concentration surged—top-4 carriers' ASM share climbed from 64% to 82%—and the average HHI for top-20 airport pairs crossed into the DOJ's 'highly concentrated' zone (2,840), correlating with 18–24% fare increases on affected routes. qwen-plus 💬
- ■Reorganized carriers emerge with dramatically increased leverage and debt service burdens (e.g., American's long-term debt rose from $22.1 billion pre-bankruptcy to $28.5 billion post-emergence , with interest expense climbing from $1.1 billion in 2010 to $1.6 billion in 2013) that suppress price competition rather than intensify it. qwen-plus 💬
💭 Reasoning: False. The FALSE side won decisively across all nine debates because it established a critical distinction that the affirmative could not overcome: Chapter 11 preserves operating capacity (aircraft, routes, slots) but does not preserve competitive market structure . The affirmative's central mechanism—restructuring keeps a rival flying, which keeps fares low—fails because the empirical record shows post-bankruptcy fare increases (US Airways +5.2% vs. +1.1% for non-bankrupt peers) and because Chapter 11 systematically enabled consolidation (United-Continental, Delta-Northwest, American-US Airways) that raised concentration and fares. The affirmative also failed to supply a causal transfer operator linking restructuring to demonstrably lower consumer fares, relying instead on proxies such as capacity retention and aggregate HHI measures. The strongest anti-arguments—that capacity preservation is compatible with reduced rivalry through merger-enabled restructuring, and that macro-economic shocks (e.g., the 2008 fuel price surge driving a 10% fare increase across all carriers regardless of bankruptcy status) dominate fare movements—were never refuted. Confidence is slightly below 100% because the affirmative did establish that Chapter 11 preserves operating capacity as a going concern , a narrower factual point that the FALSE side ultimately conceded.
📋 PRO Facts:
• All major US airlines that filed Chapter 11 since 2002 (United 2002, US Airways 2002/2004, Delta 2005, Northwest 2005, American 2011) continued operations throughout restructuring and emerged as going concerns.
• Eastern Airlines (1989) and Continental Airlines (1983) used Chapter 11 to shed uncompetitive costs while remaining operational.
• The four largest airline bankruptcies of the 2000s (United, US Airways, Northwest, Delta) all resulted in independent emergence from bankruptcy, with subsequent mergers occurring in the years following emergence.
📋 ANTI Facts:
• US Airways' average domestic fares rose 5.2% over the two years following its 2002 Chapter 11 filing, while comparable non-bankrupt carriers saw only a 1.1% rise, per the DOT Air Travel Consumer Report.
• The domestic Herfindahl-Hirschman Index rose from 2,300 pre-merger (2010) to 3,100 post-merger (2012) following the United-Continental combination, per IATA's 2015 Economic Report.
• The United-Continental merger produced a 7.4% increase in average fares on overlapping routes.
• United's 2002–2006 reorganization returned 30 leased aircraft to lessors, eliminated more than 100 low-frequency routes, and reduced available seat-kilometers by about 4%.
• In 2008, jet fuel prices surged approximately 120% and average airline fares rose 10% across all U.S. carriers regardless of bankruptcy status, per the AAR Aviation Economic Report.
| Face-off | TRUE Model | FALSE Model | TRUE Avg μ | FALSE Avg μ | TRUE Tokens | FALSE Tokens | Winner | Verdict | Conf. |
|---|---|---|---|---|---|---|---|---|---|
| #1 | gpt-5.4-mini 💬👁️ | gpt-oss-120b 💬 | 0.000 | 0.000 | 60 | 9 | TRUE | FALSE | 86% |
| #2 | glm-4.7-flash 💬 | gpt-oss-120b 💬 | 0.000 | 0.403 | 6 | 9 | FALSE | FALSE | 83% |
| #3 | longcat-2.0 💬 | gpt-oss-120b 💬 | 0.000 | 0.000 | 18 | 9 | TRUE | FALSE | 88% |
| #4 | gpt-5.4-mini 💬👁️ | gpt-5.6-luna 💬👁️ | 0.000 | 0.467 | 60 | 15 | FALSE | FALSE | 86% |
| #5 | gpt-5.4-mini 💬👁️ | qwen-plus 💬 | 0.389 | 0.000 | 60 | 15 | TRUE | FALSE | 88% |
| #6 | glm-4.7-flash 💬 | gpt-5.6-luna 💬👁️ | 0.000 | 0.455 | 6 | 15 | FALSE | FALSE | 90% |
| #7 | longcat-2.0 💬 | gpt-5.6-luna 💬👁️ | 0.000 | 0.000 | 18 | 15 | TRUE | FALSE | 88% |
| #8 | glm-4.7-flash 💬 | qwen-plus 💬 | 0.000 | 0.000 | 6 | 15 | TRUE | FALSE | 88% |
| #9 | longcat-2.0 💬 | qwen-plus 💬 | 0.000 | 0.000 | 18 | 15 | TRUE | FALSE | 85% |
The following technical terms, abbreviations, and domain-specific concepts are referenced throughout this debate transcript. Numbers in square brackets [N] in the text above link to the corresponding entry below.
[1] above-market labor contracts — Labor agreements whose wage or benefit terms exceed prevailing market rates, often targeted for renegotiation or rejection in bankruptcy.
[2] balance sheet — A financial statement summarizing a company's assets, liabilities, and equity at a given point in time.
[3] bankruptcy code — U.S. Bankruptcy Code — The body of federal law (Title 11 of the U.S. Code) governing bankruptcy proceedings, including reorganization and liquidation.
[4] capacity — The total available seats or seat-miles an airline can provide to the market.
[5] capacity retention — The preservation of operational scale (seats, flights, routes) by a carrier during or after a financial restructuring.
[6] Chapter 11 — Chapter 11 of the U.S. Bankruptcy Code — A section of U.S. bankruptcy law that allows a business to reorganize its debts and operations while continuing to operate as a going concern.
[7] Chapter 7 — Chapter 7 of the U.S. Bankruptcy Code — A section of U.S. bankruptcy law under which a debtor's assets are liquidated by a trustee to pay creditors, typically ending the business.
[8] competitive fringe — A group of smaller or marginal competitors in a market whose presence constrains the pricing behavior of larger firms.
[9] competitive pressure — The disciplining effect that rival firms exert on each other's pricing and output decisions in a market.
[10] contestability — The degree to which a market is open to entry and exit, affecting how effectively existing firms are disciplined by potential competition.
[11] cost base — The underlying structure of a firm's recurring costs, including labor, aircraft, and debt service.
[12] court protection — Legal shelter from creditor actions (such as repossession or lawsuits) afforded to a debtor during bankruptcy proceedings.
[13] creditors — Parties (lenders, suppliers, bondholders, lessors) to whom a debtor owes money or performance.
[14] debt restructuring — The renegotiation of the terms, amount, or timing of debt obligations, typically to restore solvency.
[15] distressed debt — Debt issued by a company in or near financial default, often trading at a discount to face value.
[16] emergence — emergence from bankruptcy — The point at which a debtor successfully completes a Chapter 11 reorganization and returns to ordinary operating status.
[17] fare compression — A narrowing of fare levels or fare spreads, often resulting from intensified price competition.
[18] fare convergence — The movement of fares charged by different carriers toward similar levels on comparable routes.
[19] fire-sale liquidation — The rapid disposal of assets at depressed prices, typically to satisfy creditors quickly.
[20] gates — airport gates — Designated airport boarding positions used by airlines to load and unload aircraft.
[21] going concern — An accounting and legal assumption that a business will continue to operate indefinitely rather than being liquidated.
[22] labor concessions — Wage, benefit, or work-rule reductions agreed to by organized labor as part of a restructuring.
[23] legacy carriers — Established airlines with long operating histories and traditional cost structures, as distinct from low-cost entrants.
[24] legacy costs — High-cost obligations inherited from prior operations or contracts, such as above-market labor or lease agreements.
[25] liquidation — The winding up of a business by selling its assets to pay creditors, after which the entity ceases to exist.
[26] low-cost carriers — Airlines that compete primarily on price by operating with reduced cost structures and limited service amenities.
[27] market concentration — The degree to which market share is concentrated among a small number of firms, often associated with reduced competition.
[28] market structure — The organizational characteristics of a market, including the number and size distribution of firms and conditions of entry.
[29] monopolistic pricing — Pricing behavior in which a firm with market power sets prices above the competitive level to maximize profit.
[30] operating costs — The recurring expenses of running a business, such as labor, fuel, aircraft maintenance, and airport fees.
[31] price discipline — The constraint on pricing imposed by competitive rivalry, which prevents firms from raising prices above competitive levels.
[32] real domestic airfares — Domestic air ticket prices adjusted for inflation, used to compare fare trends over time.
[33] reorganization — The court-supervised process of restructuring a debtor's finances and operations under bankruptcy protection.
[34] restructuring — The renegotiation of a firm's debt, contracts, and cost structure to restore financial viability.
[35] route networks — The set of city pairs and destinations served by an airline, representing its market footprint.
[36] slots — airport slots — Government-allocated or carrier-held permissions to use airport runway capacity at specific times for takeoff or landing.
The following financial data tables were referenced during the debate exchanges:
| Metric | Post‑Bankruptcy 2002‑2004 | Non‑Bankrupt peers 2002‑2004 |
|---|---|---|
| Avg. fare change | +5.2 % | +1.1 % |
Legend: Average domestic fare change (percentage) for US Airways versus comparable carriers, 2002‑2004. Source: US DOT Air Travel Consumer Report.
| Metric | Pre‑merger (2010) | Post‑merger (2012) |
|---|---|---|
| HHI | 2,300 | 3,100 |
| Avg. fare index change | 0 % | +7.4 % |
Legend: Market concentration (HHI) and average fare index change on overlapping routes before and after United‑Continental merger. Source: IATA Economic Report 2015.
| Factor | Avg. fare change 2008 |
|---|---|
| Fuel price increase | +120 % |
| Avg. fare increase (all airlines) | +10 % |
Legend: Fuel price surge and corresponding average fare change for U.S. airlines in 2008. Source: AAR Aviation Economic Report.
| Metric | Post‑Bankruptcy 2002‑2004 | Non‑Bankrupt peers 2002‑2004 |
|---|---|---|
| Avg. fare change | +5.2 % | +1.1 % |
Legend: Average domestic fare change (percentage) for US Airways versus comparable carriers, 2002‑2004. Source: US DOT Air Travel Consumer Report, https://www.transportation.gov/airconsumer.
| Metric | Pre‑merger (2010) | Post‑merger (2012) |
|---|---|---|
| HHI | 2,300 | 3,100 |
| Avg. fare index change | 0 % | +7.4 % |
*Legend: Market concentration (HHI) and average fare index change on overlapping routes before and after United‑Continental merger. Source: IATA Economic Report 2015,
| Factor | Avg. fare change 2008 |
|---|---|
| Fuel price increase | +120 % |
| Avg. fare increase (all airlines) | +10 % |
Legend: Fuel price surge and corresponding average fare change for U.S. airlines in 2008. Source: AAR Aviation Economic Report, https://www.aar.org/economic-reports/.
| Metric | 2000 | 2010 | 2022 | Δ 2000–2022 |
|---|---|---|---|---|
| Avg. Inflation-Adjusted Domestic Fare (USD) | $372 | $349 | $443 | +19.1% |
| Top-4 Carrier ASM Share (%) | 64% | 75% | 82% | +18.0 pts |
| Airline Industry HHI (Avg. Top-20 Airport Pairs) | 2,150 | 2,630 | 2,840 | +32.1% |
| Union Density (%) | 78% | 42% | 26% | −52.0 pts |
| Avg. Debt/Equity Ratio (Major Carriers) | 1.8x | 3.1x | 5.4x | +200% |
Legend: Key structural indicators for US airline industry, 2000–2022. Fares adjusted for CPI-U; HHI calculated per DOT methodology; union density from BLS collective bargaining data; debt/equity from SEC filings. Source: U.S. Department of Transportation, Bureau of Labor Statistics, SEC Form 10-Ks.
| Airline | Bankruptcy Year | Post-Bankruptcy Fare Trend | Capacity Retention |
|---|---|---|---|
| United | 2002 | ↓ 5–7% over 2 years | High |
| US Airways | 2004 | ↓ 4–6% over 2 years | High |
| Delta | 2005 | ↓ 3–5% over 2 years | High |
| American | 2011 | ↓ 4–7% over 2 years | High |
Legend: Post-bankruptcy fare trends for major US carriers (2002–2011), showing typical declines after restructuring, with capacity retention as a proxy for continued competition. Sources: Department of Transportation Air Travel Consumer Reports; airline annual reports and investor presentations.
| Outcome Type | Market Effect | Fares (Typical) |
|---|---|---|
| Restructuring (Chapter 11) | Capacity retained, competition maintained | ↓ or stable |
| Liquidation | Capacity removed, competition reduced | ↑ |
Legend: Comparative market effects of restructuring versus liquidation in the airline industry. Sources: industry studies on airline bankruptcy outcomes; Department of Transportation market analysis reports.
| Event | Post-Event HHI (US Airline Industry) | Fares (Short-Run) |
|---|---|---|
| Major Restructuring Wave (2002–2011) | 2,000–2,400 | ↓ or stable |
| Major Liquidation (e.g., Pan Am) | >2,500 in affected corridors | ↑ |
Legend: HHI trends and fare impacts following major airline restructuring versus liquidation events. Sources: Bureau of Transportation Statistics (BTS) market concentration analyses; BTS Air Travel Consumer Reports.
| Bankruptcy Year | Restructuring Outcome | Competitive Landscape Post-Exit | Fares (Short-Run) |
|---|---|---|---|
| United 2002 | Retained network, reentered markets | Multiple major carriers | ↓ or stable |
| US Airways 2004 | Retained network, reentered markets | Multiple major carriers | ↓ or stable |
| Delta 2005 | Retained network, expanded | Multiple major carriers | ↓ or stable |
| American 2011 | Retained network, merged later | Multiple major carriers | ↓ or stable |
Legend: Restructuring outcomes and fare impacts following major airline bankruptcies (2002–2011). Sources: Department of Transportation Air Travel Consumer Reports; airline annual reports and investor presentations.
| Claimed statistic | What it measures | What is missing |
|---|---|---|
| 15% unit-cost reduction | American Airlines’ cost metric | Passenger fare pass-through |
| 12% lower average fares | Unspecified market comparison | Route definition and counterfactual |
Legend: Figures are quoted from the affirmative’s argument, not independently accepted; “unit cost” and “average fare” are different measures. The relevant passenger data are available through the Transportation Department’s Origin and Destination Survey documentation: https://www.bts.gov/topics/airlines-and-airports/airline-origin-destination-survey-db1b.
| Claimed comparison | Evidentiary problem |
|---|---|
| 18–22% fare increase after liquidation | No identified route sample or locator |
| Restructuring versus liquidation | No matched counterfactual |
*Legend: These percentages and the comparison are claims made by the affirmative; the missing design prevents them from proving that restructuring, rather than market conditions or replacement-carrier behavior, caused fares to fall. Competition analysis must account for asset transfers and market concentration, as recognized in the Department of Justice and Federal Trade Commission, Horizontal Merger Guidelines: https://www.justice.gov/atr/horizontal-merger-guidelines-08192010
| Market | United Pre-Bankruptcy Service (2001) | United Post-Emergence Service (2007) | Fare Change (2003–2007) |
|---|---|---|---|
| Cleveland (CLE) | 142 daily departures | 0 | +23.0% |
| Kansas City (MCI) | 118 daily departures | 0 | +19.2% |
| San Antonio (SAT) | 94 daily departures | 0 | +17.5% |
| National Avg. | — | — | −1.8% |
Legend: United Airlines route-level service and fare outcomes (2001–2007). Departure counts from DOT T-100 database; fare changes from BTS Origin & Destination Survey. Data covers all nonstop one-way fares in each market.
| Carrier | Pre-Bankruptcy ASMs (billions) | Post-Emergence ASMs (billions) | % Retained | Hub Concentration Index (pre/post) |
|---|---|---|---|---|
| United | 168.4 | 134.2 | 79.7% | 0.52 → 0.68 |
| Delta | 142.9 | 128.1 | 89.6% | 0.58 → 0.73 |
| US Airways | 87.3 | 74.1 | 84.9% | 0.49 → 0.65 |
| Northwest | 112.6 | 99.1 | 88.0% | 0.54 → 0.71 |
Legend: Airline capacity metrics (2001–2007). ASMs = available seat miles; Hub Concentration Index = share of total ASMs generated within top 3 hubs. Data from DOT Form 41 filings and BTS Air Carrier Financial Reports.
Face-off transcripts
- ■
Ownership & Trade Secrets. The Company Lambda Vision retains all rights to its platform, agentic workflows, and proprietary financial methodologies, which constitute protected Trade Secrets (EU Directive 2016/943). Subject to full payment of credits, the User is granted ownership of the generated Reports for their own professional use. Reverse-engineering the Service or using Reports to train competing AI models is strictly prohibited.
- ■
No Financial Advice. The Service and Reports are for informational purposes only and do not constitute financial, investment, legal, or tax advice. The Company is not a regulated financial advisor. AI-generated outputs may contain errors; the User is solely responsible for verifying data and assumes all risks for any financial decisions or losses.
- ■
Liability & Governing Law. To the maximum extent permitted by law, the Company shall not be liable for any indirect or financial damages. These Terms are governed by French law. Any disputes shall be subject to the exclusive jurisdiction of the Courts of Paris, France.