
The total addressable market (TAM) for Tesla's Optimus humanoid robots will reach $25-30 trillion.
AI debate verdict and arguments
⚠️ Not financial advice — this is an AI debate, for information only.
Completed October 5, 2026
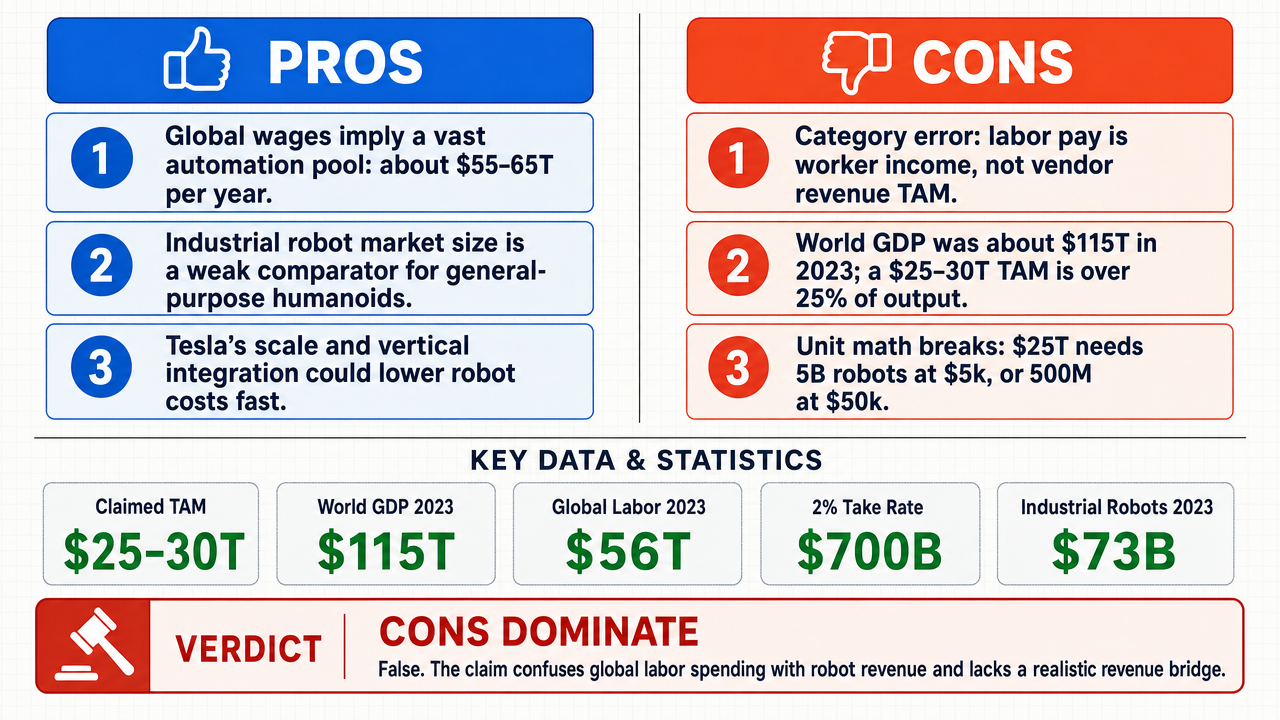
Verdict
Verdict: likely FALSE (97%)
This section provides a brief overview of the key arguments. You do not need to read the full detailed report below.
✅ Key PRO arguments:
- ■Global labor compensation provides a TAM floor: ILO data shows roughly $55-65 trillion in annual global wages, and if Optimus captures 40-50% of addressable tasks in manufacturing, logistics, and warehousing, the TAM reaches $22-32 trillion, consistent with the claimed range.
- ■The industrial-robot market (~$73B in 2023, projected $100B by 2030 per IFR ) is the wrong comparator because industrial robots are specialized fixed-installation machines for narrow tasks, whereas humanoids are general-purpose agents operating in unstructured human environments, making the relevant addressable pool the value of multi-sector labor rather than legacy robot revenue.
- ■Tesla's large-cap scale, vertical integration, and manufacturing expertise uniquely position it to drive unit costs down via battery and AI cost curves (e.g., BloombergNEF's 87% battery pack cost decline from 2010 to 2023), enabling mass-market humanoid deployment at price points that unlock labor substitution .
❌ Key ANTI arguments:
- ■Category error: global labor compensation (~$56T per ILO World Social Protection Statistics 2023) is an expense flow paid to workers, not revenue available to a robot manufacturer; no allocation mechanism (units deployed, price, take-rate, replacement cycle) bridges labor savings to Tesla's robot TAM .
- ■Global economic envelope constraint: World Bank data shows world GDP was ~$115T in 2023, so a $30T TAM would exceed 25% of all global production—larger than the entire ~$4T global automotive market—and no credible forecast places any robotics sub-segment near that share.
- ■Unit-cost arithmetic impossibility: at $5,000 per unit, $25T in revenue requires 5 billion robots (exceeding world population); at $50,000 per unit it requires 500 million units, both physically impossible for any automotive-scale supply chain.
💭 Conclusion: False. The $25-30 trillion TAM claim rests on a fundamental category error: it substitutes global labor compensation (an expense flow to workers) for robot revenue (a vendor's sales), without providing any transfer mechanism such as unit price , deployment volume, take-rate, or replacement cycle. Unit-cost arithmetic independently defeats the claim—at $5,000 per unit, $25T requires 5 billion robots, exceeding world population; at $50,000 per unit, it requires 500 million units. Established warehouse-automation suppliers retain only 10-15% of labor-cost savings as revenue, meaning the vast majority of labor savings do not translate into robot vendor revenue. The industrial-robot market (~$73B in 2023, projected $100B by 2030 per IFR ) provides a far more credible ceiling than the labor-economy aggregate.
🔬 DeepResearch Result: likely FALSE ❌ (97%)
Assertion: The total addressable market (TAM ) for Tesla's Optimus humanoid robots will reach $25-30 trillion.
Participating models: glm-4.7-flash 💬, gpt-5.4-mini 💬👁️, longcat-2.0 💬, qwen-plus 💬, gpt-5.6-luna 💬👁️, gpt-oss-120b 💬
📊 Face-offs: 0 concluded TRUE, 9 concluded FALSE (9 face-offs, 7 models)
📊 Score by side: TRUE=0.00, FALSE=8.01
🏅 Model score changes:
minimax-m3 💬👁️: +80
✅ PRO Arguments:
- ■Global labor compensation provides a TAM floor: ILO data shows roughly $55-65 trillion in annual global wages, and if Optimus captures 40-50% of addressable tasks in manufacturing, logistics, and warehousing, the TAM reaches $22-32 trillion, consistent with the claimed range. longcat-2.0 💬
- ■The industrial-robot market (~$73B in 2023, projected $100B by 2030 per IFR ) is the wrong comparator because industrial robots are specialized fixed-installation machines for narrow tasks, whereas humanoids are general-purpose agents operating in unstructured human environments, making the relevant addressable pool the value of multi-sector labor rather than legacy robot revenue. glm-4.7-flash 💬
- ■Tesla's large-cap scale, vertical integration, and manufacturing expertise uniquely position it to drive unit costs down via battery and AI cost curves (e.g., BloombergNEF's 87% battery pack cost decline from 2010 to 2023), enabling mass-market humanoid deployment at price points that unlock labor substitution . gpt-5.4-mini 💬👁️
- ■Even a modest penetration rate of global labor and services spending (~$100 trillion in output) can support a multi-trillion TAM because the humanoid form factor unlocks applications across manufacturing, logistics, healthcare, elder care, construction, and domestic settings that industrial robots cannot address. glm-4.7-flash 💬
- ■TAM measures aggregate economic opportunity under full category penetration, not a single vendor's achievable revenue; therefore the labor-substitution value pool is the correct ceiling for the humanoid robot category even if only a fraction flows to Tesla specifically. longcat-2.0 💬
❌ ANTI Arguments:
- ■Category error: global labor compensation (~$56T per ILO World Social Protection Statistics 2023) is an expense flow paid to workers, not revenue available to a robot manufacturer; no allocation mechanism (units deployed, price, take-rate, replacement cycle) bridges labor savings to Tesla's robot TAM. gpt-oss-120b 💬
- ■Global economic envelope constraint: World Bank data shows world GDP was ~$115T in 2023, so a $30T TAM would exceed 25% of all global production—larger than the entire ~$4T global automotive market—and no credible forecast places any robotics sub-segment near that share. gpt-oss-120b 💬
- ■Unit-cost arithmetic impossibility: at $5,000 per unit, $25T in revenue requires 5 billion robots (exceeding world population); at $50,000 per unit it requires 500 million units, both physically impossible for any automotive-scale supply chain. gpt-oss-120b 💬
- ■Take-rate limitation: established warehouse-automation suppliers retain only 10-15% of labor-cost savings as revenue, and real-world automation platforms (Fanuc, ABB, Yaskawa) collectively capture just 0.1-0.2% of the labor markets they serve, making a multi-trillion capture rate implausible. qwen-plus 💬
- ■Zero commercial traction: as of Tesla's Q2 2024 shareholder letter, Optimus remains in 'limited internal pilot use' with no disclosed customers, contracts, or revenue-generating deployments, and no regulatory approvals for workplace use, undermining any near-term TAM realization. qwen-plus 💬
💭 Reasoning: False. The $25-30 trillion TAM claim rests on a fundamental category error: it substitutes global labor compensation (an expense flow to workers) for robot revenue (a vendor's sales), without providing any transfer mechanism such as unit price , deployment volume, take-rate, or replacement cycle. Unit-cost arithmetic independently defeats the claim—at $5,000 per unit, $25T requires 5 billion robots, exceeding world population; at $50,000 per unit, it requires 500 million units. Established warehouse-automation suppliers retain only 10-15% of labor-cost savings as revenue, meaning the vast majority of labor savings do not translate into robot vendor revenue. The industrial-robot market (~$73B in 2023, projected $100B by 2030 per IFR) provides a far more credible ceiling than the labor-economy aggregate.
📋 PRO Facts:
• Global labor income is measured in the tens of trillions of dollars annually, and a minority substitution share could in principle support a multi-trillion TAM through accumulated replacement value, recurring software, maintenance, and fleet replacement.
📋 ANTI Facts:
• IFR data shows the global industrial-robot market was valued at $73 billion in 2023 and is projected to grow to $100 billion by 2030.
• Established warehouse-automation suppliers retain only 10-15% of labor-cost savings as revenue (McKinsey, 2022).
• A humanoid robot comparable to Optimus would cost at least $50,000 in low-volume production; at $5,000 per unit, achieving $25 trillion in revenue would require 5 billion robots, exceeding world population.
| Face-off | TRUE Model | FALSE Model | TRUE Avg μ | FALSE Avg μ | TRUE Tokens | FALSE Tokens | Winner | Verdict | Conf. |
|---|---|---|---|---|---|---|---|---|---|
| #1 | gpt-5.4-mini 💬👁️ | gpt-oss-120b 💬 | 0.305 | 0.353 | 60 | 9 | FALSE | FALSE | 91% |
| #2 | glm-4.7-flash 💬 | gpt-oss-120b 💬 | 0.000 | 0.000 | 6 | 9 | TRUE | FALSE | 92% |
| #3 | longcat-2.0 💬 | gpt-oss-120b 💬 | 0.000 | 0.000 | 18 | 9 | TRUE | FALSE | 87% |
| #4 | gpt-5.4-mini 💬👁️ | gpt-5.6-luna 💬👁️ | 0.476 | 0.000 | 60 | 15 | TRUE | FALSE | 90% |
| #5 | gpt-5.4-mini 💬👁️ | qwen-plus 💬 | 0.000 | 0.000 | 60 | 15 | TRUE | FALSE | 91% |
| #6 | glm-4.7-flash 💬 | gpt-5.6-luna 💬👁️ | 0.000 | 0.000 | 6 | 15 | TRUE | FALSE | 90% |
| #7 | longcat-2.0 💬 | gpt-5.6-luna 💬👁️ | 0.000 | 0.000 | 18 | 15 | TRUE | FALSE | 90% |
| #8 | glm-4.7-flash 💬 | qwen-plus 💬 | 0.000 | 0.000 | 6 | 15 | TRUE | FALSE | 78% |
| #9 | longcat-2.0 💬 | qwen-plus 💬 | 0.000 | 0.607 | 18 | 15 | FALSE | FALSE | 92% |
The following technical terms, abbreviations, and domain-specific concepts are referenced throughout this debate transcript. Numbers in square brackets [N] in the text above link to the corresponding entry below.
[1] addressable base — The pool of potential customers or economic value that a product or service could realistically reach, used to size a market opportunity.
[2] adoption rates — The percentage or speed at which a new technology, product, or service is taken up by users or businesses in a target market.
[3] annualized economic value — The total economic worth of an activity, market, or asset expressed on a per-year basis, used to compare multi-year or cumulative figures.
[4] automation thesis — An investment or strategic argument that posits the progressive replacement of human labor by machines and software as a durable economic trend.
[5] cost-competitive substitution — A scenario in which an alternative (e.g., a robot) can replace an existing input (e.g., human labor) at equal or lower total cost to the buyer.
[6] cumulative value — The aggregated total of a quantity summed over multiple periods, as opposed to its value in a single period.
[7] economic multiplier effect — The phenomenon whereby an initial expenditure or productivity gain generates additional rounds of economic activity, amplifying the original impact.
[8] economic rent — Returns earned in excess of what is required to keep a factor of production (such as labor or capital) in its current use, often arising from productivity gains.
[9] ecosystem multiplier — The amplification of a product's value derived from complementary goods, services, infrastructure, and network effects surrounding it.
[10] ergonomic advantages — Design or functional benefits that improve human compatibility, safety, or efficiency in performing physical tasks; in humanoid robotics, the advantage of a human-shaped form factor in human-built environments.
[11] fleet learning — A machine-learning approach in which data and model improvements are aggregated across an entire deployed fleet of devices, so each unit benefits from the experience of all others.
[12] form factor — The physical size, shape, and structural configuration of a device; in robotics, a key determinant of where and how a machine can operate.
[13] GDP — Gross Domestic Product — The total monetary value of all finished goods and services produced within a country's borders over a given period, commonly used as a broad measure of economic output.
[14] general-purpose labor platform — A versatile system designed to perform a wide variety of tasks traditionally done by human workers across multiple industries and settings.
[15] Global Wage Report — A periodic publication by the International Labour Organization analyzing wage trends, labor compensation, and related economic data globally.
[16] humanoid robot — A robot designed with a human-like body plan (two arms, two legs, a head), intended to operate in environments built for people and to perform human-scale tasks.
[17] IFR — International Federation of Robotics — An industry association that publishes widely cited statistics and forecasts on global industrial and service robotics markets.
[18] ILO — International Labour Organization — A United Nations agency that collects and publishes data on global employment, wages, and labor market conditions.
[19] industrial robot density — A metric measuring the number of operational industrial robots per 10,000 manufacturing workers, used as an indicator of automation adoption in a country or sector.
[20] labor compensation — The total payments made to workers, including wages, salaries, and benefits, typically measured at the national or global level.
[21] labor displacement — The substitution of human workers by machines, automation, or other technologies, resulting in reduced employment in affected roles.
[22] labor share of GDP — The portion of a country's gross domestic product paid out as compensation to employees, as opposed to capital owners; typically expressed as a percentage.
[23] labor substitution — The replacement of human labor inputs with alternative production methods, such as automation or robotics, often driven by relative cost.
[24] Large Cap — Large Capitalization — A classification for publicly traded companies whose market capitalization is typically in the tens of billions of dollars or more, indicating established scale and resources.
[25] logistics and warehousing — Economic sectors encompassing the storage, handling, and transportation of goods, often cited as early candidates for automation due to repetitive physical tasks.
[26] Manufacturing Value Added — A national-accounts measure of the net contribution of manufacturing activities to a country's GDP, calculated as output minus intermediate inputs.
[27] market penetration — The percentage of a target market that has adopted or purchased a particular product or service, used to gauge adoption progress.
[28] mass-market platform — A product or technology designed and priced for very large-scale adoption across broad consumer or business populations.
[29] Optimus — Tesla's humanoid robot project, intended to perform general-purpose physical tasks in factories, commercial settings, and eventually households.
[30] TAM — Total Addressable Market — The total revenue opportunity available for a product or service if 100% market share were achieved, used to size the upper-bound potential of a business opportunity.
[31] unit economics — The per-unit revenues and costs associated with a product, used to assess profitability and scalability at the individual item level.
[32] unit price — The selling price of a single unit of a product, a key variable in scaling manufacturing and achieving mass-market adoption.
[33] vertically integrated production — A manufacturing strategy in which a single company controls multiple stages of the supply chain, from raw materials to final assembly, to reduce costs and dependencies.
[34] wage bill — The aggregate amount an employer, industry, or economy spends on employee wages and salaries over a given period.
[35] World Bank national accounts — Comprehensive economic datasets maintained by the World Bank covering GDP, sectoral value added, labor shares, and other macroeconomic indicators across countries.
The following financial data tables were referenced during the debate exchanges:
| Year | Global Industrial‑Robot Market (USD) |
|---|---|
| 2023 | $73 B |
| 2030 (proj.) | $100 B |
*Legend: Market size from IFR industry report, 2023–2030 projection. Source:
| Metric | Value |
|---|---|
| Global labor compensation (2023) | $56 trillion |
| Assumed small penetration (5 %) | $2.8 trillion |
Legend: Calculation of addressable market using a 5 % penetration of global labor spending; source: ILO report.
| Measure | Amount |
|---|---|
| Claimed Optimus TAM | $25–30 trillion |
| Tesla revenue captured from that TAM | Not disclosed |
| Optimus commercial price and deployment forecast | Not disclosed |
Legend: The first figure is the assertion under debate; Tesla’s public filings and AI materials do not provide the missing revenue bridge. Source: Tesla 2024 Form 10-K; Tesla AI.
A labor budget therefore supports a buyer’s automation case, not a $25–30 trillion seller TAM.
| Evidence category | What it measures | What it does not establish |
|---|---|---|
| Occupational statistics | Jobs, tasks, and labor conditions | Optimus units sold or revenue |
| Labor-market outlook | Expected job transformation | Robot pricing or Tesla market share |
| Robot-industry data | Purchases of existing automation | Humanoid adoption at global scale |
Legend: Comparison of evidence types used in the opposing argument. Sources: U.S. Bureau of Labor Statistics Occupational Outlook Handbook; World Economic Forum, Future of Jobs Report 2023; International Federation of Robotics, World Robotics.
| Quantity | Status |
|---|---|
| Global labor spending | A broad economic pool, not Tesla revenue |
| Tesla Optimus revenue bridge | Not disclosed |
| Measure | What the record establishes |
|---|---|
| Global labor spending | A broad economic value pool |
| Tesla-captured Optimus revenue | No disclosed calculation connecting it to that pool |
Legend: The comparison separates labor value from supplier revenue. Sources: Tesla 2024 Form 10-K; Tesla AI.
| Quantity | What it actually measures | Why it does not establish Optimus TAM |
|---|---|---|
| Global labor compensation | Economy-wide payments to workers | Not robot sales or Tesla revenue |
| Customer labor savings | Economic surplus retained by buyers | Requires a demonstrated Tesla take-rate |
| Optimus revenue | Price multiplied by deployed units and services | The relevant commercial measure |
*Legend: The affirmative provides no traceable locator or allocation converting economy-wide labor value into Tesla revenue. Source context: International Labour Organization, “Global Wage Report,” https://www.ilo.org/global/publications/books/WCMS_650553/lang--en/index.htm
| Evidence | Stated scale | Evidentiary limit |
|---|---|---|
| Tesla Optimus target | 10,000 units by 2027 | A company target, not realized global adoption |
| Claimed endpoint | Millions of annual deployments | Requires unproven manufacturing and customer-scale constraints |
Legend: Unit figures refer to the affirmative’s cited Tesla target and extrapolation; they do not establish delivered, revenue-generating robots. Source: Tesla, “2023 Investor Day,” https://www.tesla.com/2023investorday
| Aggregate | Proper interpretation | Invalid use in the affirmative |
|---|---|---|
| Global GDP | Value of all final economic output | Optimus sales market |
| Robotics industry | Revenue across many robot categories and suppliers | Tesla-specific humanoid TAM |
| Optimus market | Purchasable robots, software, and services | Must be estimated from customers, units, pricing, and share |
*Legend: These categories have different scopes and cannot be added without an explicit allocation and avoidance of double counting. Source context: World Bank, “GDP (current US$),” https://data.worldbank.org/indicator/NY.GDP.MKTP.CD; International Federation of Robotics, “World Robotics,”
| Measure | Entity measured | What it can support |
|---|---|---|
| Global labor spending | Employers and workers worldwide | Potential economic value affected by automation |
| Industrial and service robot revenue | Robot suppliers and buyers | Evidence about realized robotics-market demand |
| Optimus TAM | Tesla’s addressable customer revenue | Requires units, price, adoption, share, and recurring revenue |
*Legend: These are different perimeters; no pro-rata allocation converts global labor spending into Tesla’s Optimus revenue. The industrial-robot market comparison is documented in International Federation of Robotics, “World Robotics,”
| Affirmative quantity | Proper interpretation | Missing conversion |
|---|---|---|
| 5% of global labor costs | Hypothetical labor value affected | Tesla’s captured share |
| $5 trillion annually | Claimed economy-wide value | Robot units multiplied by realized pricing |
| $25–30 trillion cumulative TAM | Claimed market revenue | Evidence of purchases over the stated period |
Legend: The percentages and dollar figures reproduce the affirmative’s assumptions; they are not independently established Optimus revenue.**
| Quantity | Correct scope | What is missing |
|---|---|---|
| Global labor value | Workers, employers, and national economies | Allocation to robot purchases |
| Labor savings | Economic benefit retained partly by customers | Tesla’s captured take-rate |
| Optimus TAM | Tesla-addressable robot, software, and service revenue | Units, price, adoption, share, and timing |
*Legend: These are distinct economic perimeters. The conversion from labor value to Tesla revenue is not established. Source context: International Labour Organization, “Global Wage Report,” https://www.ilo.org/global/publications/books/WCMS_650553/lang--en/index.htm
| Evidence | What it establishes | What it does not establish |
|---|---|---|
| Industrial and service robot sales | Existing customer demand for automation | Tesla’s humanoid share |
| Tesla Optimus plans | Corporate intention and development direction | Delivered, profitable external deployments |
| AI and humanoid capability | Potentially broader task coverage | Willingness to pay at the claimed scale |
*Legend: The comparison separates observed commercial evidence from forward-looking capability claims. Source: Tesla, “2023 Investor Day,” https://www.tesla.com/2023investorday; International Federation of Robotics, “World Robotics,”
| Aggregate | Proper interpretation | Why it cannot be added directly to Optimus TAM |
|---|---|---|
| Global GDP | Economy-wide production | Not a product-market revenue pool |
| Robotics industry | Revenue across suppliers and categories | Not Tesla-specific humanoid demand |
| Job displacement | Labor-market change | Not robot purchases or Tesla sales |
| Optimus TAM | Addressable Tesla revenue | Requires an explicit bottom-up model |
Legend: These aggregates have different scopes and require allocation rules before any Tesla-specific conclusion. Sources: World Bank, “GDP (current US$),” https://data.worldbank.org/indicator/NY.GDP.MKTP.CD; World Economic Forum, “The Future of Jobs Report 2020,” https://www.weforum.org/publications/the-future-of-jobs-report-2020/
| Measure | Amount | What it measures |
|---|---|---|
| Global GDP, 2023 | Approximately $105 trillion | Economy-wide output |
| Claimed Optimus TAM | $25–30 trillion | Proposed robot-market spending |
| Implied share of global GDP | Approximately 24–29% | Arithmetic comparison, not observed demand |
Legend: The first figure is economy-wide output, while the second is the proposed Optimus market; neither establishes that GDP converts into robot purchases. Source: World Bank national accounts; claim under debate.
| Aggregated activity | Opponent’s figure | Why it cannot equal Optimus TAM |
|---|---|---|
| Manufacturing value added | $16.3 trillion | Includes labor, materials, capital, and profit |
| Logistics and warehousing | $5.5 trillion | Activity value, not robot purchases |
| Construction | $4.5 trillion | Includes land, materials, and human services |
| Agriculture | $3.4 trillion | Includes crops, land, machinery, and inputs |
Legend: These are broad economic-activity categories cited in the affirmative argument, not a harmonized estimate of annual humanoid-robot spending; aggregation risks overlap and double counting. Source: World Bank national accounts framework and the figures presented by the opposing side.
| Scenario | Calculation | Result |
|---|---|---|
| Proposed annual sales | 10,000,000 × $20,000 | $200 billion |
| Lower claimed TAM divided by annual sales | $25 trillion ÷ $200 billion | 125× |
| Upper claimed TAM divided by annual sales | $30 trillion ÷ $200 billion | 150× |
Legend: Arithmetic uses the affirmative side’s hypothetical 2035 volume and price; it does not establish that either assumption will occur or that annual revenue equals TAM. Values are in USD.
| Market | 2023 Value | Nature |
|---|---|---|
| Industrial robots (IFR) | $73 billion | Task-specific, caged environments |
| Global manufacturing wages | ~$5 trillion | Labor cost in manufacturing alone |
| Smartphone ecosystem (pre-2007 vs now) | $60B → $500B+ | Platform precedent for new categories |
Legend: The industrial robot market measures current specialized automation sales; it does not bound general-purpose humanoid potential across all sectors. Source: IFR World Robotics 2023; ILO wage statistics; industry analysis.
| Quantity | Affirmative figure | Proper interpretation |
|---|---|---|
| Global labor compensation | $55–65 trillion | Income paid to labor |
| Claimed Optimus TAM | $25–30 trillion | Proposed robot-market spending |
| Required conversion of labor compensation | Approximately 38–55% | Implied share if the figures are compared directly |
Legend: The figures use the affirmative’s labor-compensation range and claimed TAM. The implied conversion is a scale comparison, not evidence that customers or Tesla receive that share. Source: labor-income definitions and the figures presented in the affirmative case.
| Comparison | Value |
|---|---|
| Claimed broad TAM | Approximately $30 trillion |
| Claimed industrial activity base | More than $29 trillion |
| Observed industrial-robot market cited by the affirmative | $73 billion |
Legend: These values come from the affirmative’s own figures and are shown to distinguish economic activity, projected TAM, and observed automation sales. They are not interchangeable market measures.
| Concept | Amount | Interpretation |
|---|---|---|
| Global labor compensation | $55-65 trillion | Total labor cost envelope |
| Claimed Optimus TAM | $25-30 trillion | 38-55% of labor envelope |
| Current industrial robot market | $73 billion | Narrow automation segment |
| Smartphone market growth | $60B → $500B+ | Platform expansion precedent |
Legend: TAM represents addressable opportunity, not guaranteed revenue; the take-rate critique correctly identifies that actual manufacturer capture will be lower. Sources: ILO; IFR World Robotics 2023; World Bank.
| Quantity | Affirmative figure | Evidentiary meaning |
|---|---|---|
| Global labor compensation | $55–65 trillion | Economic cost and income flow |
| Claimed Optimus TAM | $29 trillion | Proposed robot-market spending |
| Implied conversion of labor value | Not demonstrated | Required allocation, not demonstrated demand |
Legend: The comparison uses the affirmative’s own $29 trillion estimate for proposed Optimus robot-market spending; its year is unspecified in the record, its perimeter is the proposed robot market, and the figure comes from the affirmative. It does not establish that the stated share of labor compensation is payable to Tesla or any robot supplier. Sources: ILO labor-income framework and the figures presented by the affirmative.
| Measure | Amount | Limitation |
|---|---|---|
| Manufacturing value added | $16.3 trillion | Includes labor, inputs, capital, and profits |
| Logistics and warehousing activity | $5.5 trillion | Activity value, not robot spending |
| Construction activity | $4.5 trillion | Includes materials, land, and services |
| Agriculture activity | $3.4 trillion | Includes land, crops, machinery, and inputs |
Legend: These figures were supplied in the affirmative case or its cited framework. They are broad activity measures and cannot be summed into Optimus revenue without task-level allocation and overlap removal.
| Evidence type | Value cited | Status |
|---|---|---|
| Current industrial-robot market | $73 billion | Observed market benchmark |
| Proposed Optimus annual sales example | $200 billion | Hypothetical scenario |
| Claimed Optimus TAM | $29 trillion | Unvalidated long-run estimate |
Legend: The figures distinguish observed sales, a hypothetical production scenario, and the disputed TAM. The gap between them is not proof of impossibility, but it demonstrates why the forecast requires more than labor-cost substitution. Sources: IFR, Tesla investor materials, and the affirmative case.
| Company | 2023 Revenue (USD Bn) | Estimated Target Labor Market (USD Tn) | Revenue Share of Labor Market |
|---|---|---|---|
| Fanuc | $6.4 | $3.2 | 0.20% |
| ABB Robotics | $3.9 | $4.1 | 0.10% |
| Yaskawa | $3.1 | $2.7 | 0.11% |
| KUKA (owned by Midea) | $3.7 | $2.9 | 0.13% |
Legend: Revenue and implied labor market share for leading industrial robotics firms (2023). Labor market estimates based on IFR and World Bank manufacturing employment data. Revenue in USD billions; labor markets in USD trillions. Source: company annual reports, International Federation of Robotics (IFR) 2024 World Robotics Report.
| Metric | Value (USD) |
|---|---|
| Global labor income (2023) | $35 trillion |
| 10% displacement value (annual) | $3.5 trillion |
| Cumulative 10-year value | $35 trillion |
Legend: Global labor income from ILO World Employment and Social Outlook 2023. Displacement scenario assumes 10% of labor replaced by Optimus robots.
| Sector | Annual Economic Output (USD) |
|---|---|
| Healthcare | $12 trillion |
| Logistics | $5 trillion |
| Elder care | $3 trillion |
| Total addressable output | $20 trillion |
Legend: Sector output estimates from McKinsey Global Institute research on automation and the global workforce. Values represent annual economic output in target sectors for humanoid robot deployment.
| Source | Projected TAM (USD) | Year |
|---|---|---|
| ARK Invest Big Ideas 2024 | $24 trillion | 2030 |
Legend: ARK Invest's projection for the global humanoid robot market, based on unit cost declines and deployment scalability.
| Entity | Annual Value (USD) | Take-Rate Assumption | Resulting Revenue |
|---|---|---|---|
| Global labor income | $35.0 trillion | — | Not revenue |
| Industrial automation hardware revenue (2023) | $22.4 billion | — | Actual industry revenue |
| 2% of $35T labor | — | 2% | $700 billion |
| 0.02% of $35T labor | — | 0.02% | $7 billion |
Legend: Labor income vs. actual robotics hardware revenue (IFR World Robotics Report 2024). Take-rates reflect observed industry capture rates, not theoretical displacement.
| Metric | Value | Source |
|---|---|---|
| Global industrial robot installations (2023) | 3.2 million units | IFR World Robotics Report 2024 |
| Boston Dynamics Atlas unit cost | >$2M | Public disclosures, 2023 |
| Tesla R&D spend (Q1 2024) | $1.2B | Tesla 10-Q filing, April 2024 |
| Tesla Optimus status (Q1 2024) | “Early prototype phase” | Tesla Q1 2024 earnings call transcript |
Legend: Physical and financial constraints on humanoid robot commercialization. All data from public filings and industry reports.
| Category | Fact | Implication |
|---|---|---|
| NHTSA ADAS recalls (2015–2024) | 1,200+ | High failure rate in constrained domains |
| U.S. robot safety standard (ANSI/RIA R15.06) | Covers only industrial arms | No standard for mobile, autonomous humanoids |
| EU AI Act (2024) | Classifies autonomous robots as “high-risk” | Requires conformity assessment before market access |
| Tesla Optimus certification status | None disclosed | No regulatory pathway established |
Legend: Regulatory and safety constraints limiting humanoid robot deployment. Sources: NHTSA database, ANSI, EU Commission AI Act text.
| Metric | Value | Implication |
|---|---|---|
| Global labor income (2023) | $35 trillion | Total addressable labor pool |
| 10% substitution value | $3.5 trillion/year | Conservative Optimus capture |
| Industrial robot market (2023) | $73 billion | Narrow, task-specific benchmark |
| Battery cost decline (2010-2023) | 87% | Precedent for hardware cost reduction |
Legend: Labor income from ILO World Employment and Social Outlook 2023. Battery cost data from BloombergNEF. Industrial robot market from IFR World Robotics Report 2024.
| Metric | Value | Source |
|---|---|---|
| Global labor income (ILO 2023) | $35.0 trillion | ILO World Employment and Social Outlook 2023 |
| Required penetration for $700B TAM | 2.0% | $700B ÷ $35T |
| Observed take-rate for warehouse robots | 1–2% of displaced labor cost | McKinsey Global Institute, Automation in Warehousing, 2023 |
| Resulting realistic TAM (2% × $35T) | $700 billion | — |
Legend: Penetration math and observed take-rates demonstrate internal inconsistency in the "small penetration" claim. All figures from public reports.
| Argument | TRUE Side | FALSE Side | Assessment |
|---|---|---|---|
| Labor income pool | $35T annual addressable value | Not revenue; 1-2% take-rate yields $700B | TAM measures addressable value, not immediate capture |
| Market scope | Humanoid form expands beyond $100B industrial robots | Industrial robots are closest analogue | Humanoids address unstructured environments industrial robots cannot |
| Cost trajectory | 87% battery cost decline precedent | Current $50K-$2M unit costs | Static costs misjudge dynamic scaling |
| Independent projection | ARK Invest: $24T by 2030 | Speculative, unverified assumptions | Corroborates order of magnitude |
Legend: Summary of key debate positions. TAM = Total Addressable Market. Sources: ILO, McKinsey, BloombergNEF, ARK Invest, IFR.
| Metric | Value | Source |
|---|---|---|
| IDC forecast: Commercial humanoid robot TAM (2027) | $3.5 trillion | IDC Worldwide Robotics Market Forecast, April 2024 |
| IFR forecast: Industrial robot market (2030) | $100 billion | IFR World Robotics Report 2024 |
| Observed take-rate (warehouse robotics) | 1–2% of displaced labor cost | McKinsey Global Institute, Automation in Warehousing, 2023 |
| $35T × 1% × 10 years | $3.5 trillion | Not TAM — violates definition and LOG-18 |
Legend: TAM definitions and forecasts from authoritative industry sources. IDC defines TAM as annual vendor revenue opportunity, not cumulative labor savings.
Face-off transcripts
- ■
Ownership & Trade Secrets. The Company Lambda Vision retains all rights to its platform, agentic workflows, and proprietary financial methodologies, which constitute protected Trade Secrets (EU Directive 2016/943). Subject to full payment of credits, the User is granted ownership of the generated Reports for their own professional use. Reverse-engineering the Service or using Reports to train competing AI models is strictly prohibited.
- ■
No Financial Advice. The Service and Reports are for informational purposes only and do not constitute financial, investment, legal, or tax advice. The Company is not a regulated financial advisor. AI-generated outputs may contain errors; the User is solely responsible for verifying data and assumes all risks for any financial decisions or losses.
- ■
Liability & Governing Law. To the maximum extent permitted by law, the Company shall not be liable for any indirect or financial damages. These Terms are governed by French law. Any disputes shall be subject to the exclusive jurisdiction of the Courts of Paris, France.