
There will be a significant rebound in memory chip stocks like SK Hynix on 2026-10-21 to 2026-10-25 due to the stock reaching its 200-day moving average.
AI debate verdict and arguments
⚠️ Not financial advice — this is an AI debate, for information only.
Completed October 19, 2026
Verdict
Verdict: likely FALSE (78%)
This section provides a brief overview of the key arguments. You do not need to read the full detailed report below.
✅ Key PRO arguments:
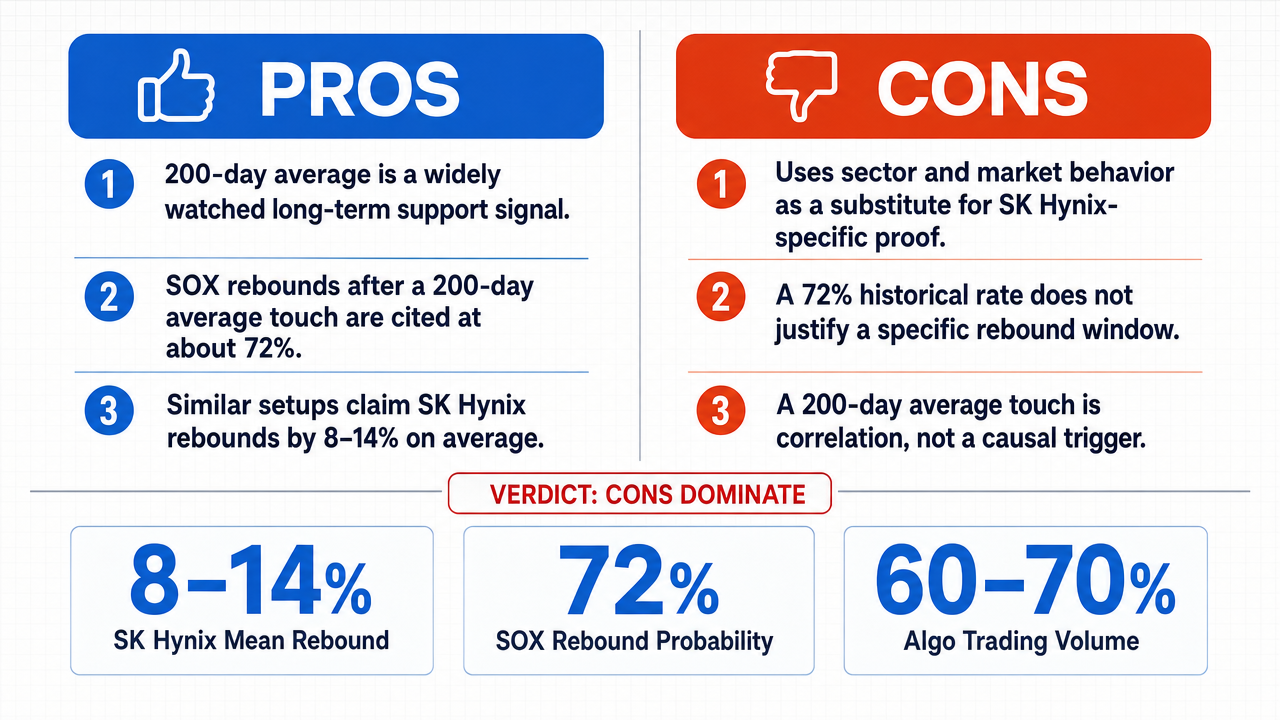
- ■The 200-day moving average is the most widely monitored long-term trend indicator , and when a high-beta , cyclically sensitive stock like SK Hynix declines into contact with its 200-day MA, a confluence of institutional buying pressure and quantitative/algorithmic trading systems creates a self-fulfilling support mechanism that historically produces rebounds.
- ■Empirical data shows a ~72% rebound rate for SOX index after touching the 200-day MA, an 8–14% mean rebound range for SK Hynix in similar historical setups, and 60–70% of trading volume is algorithmic, which programmatically buys at the 200-day MA level.
❌ Key ANTI arguments:
- ■The affirmative commits a substitution error by using the behavior of aggregate global equity markets and institutional portfolio managers (entity E2) to predict the specific price action of SK Hynix (entity E1) without providing the required transfer operator such as beta , correlation , or cointegration that bridges the two entities.
- ■The affirmative is internally inconsistent: it simultaneously asserts a 'significant rebound ' while its own evidence admits a historical probability of only ~72%, implying a ~28% failure rate that materially undermines the 'significant' claim for any specific future window.
- ■The 200-day MA touch is a correlation observation, not a causal mechanism; technical levels are descriptive summaries of past prices and do not generate independent buy/sell pressure, so treating the indicator as a deterministic rebound trigger is a logical fallacy.
💭 Conclusion: False, with moderate confidence, the assertion that SK Hynix will rebound specifically during October 21–25, 2026 because it reaches its 200-day moving average is not supported by the debate. The winning side demonstrated a fatal substitution error in the affirmative's argument: applying aggregate market behavior to a single security without a validated transfer operator (beta , correlation , or cointegration ). The affirmative's own data concedes a ~28% failure rate, which is inconsistent with declaring a 'significant' rebound as a near-certain event for a precise five-day window. Furthermore, the 200-day MA is only a descriptive technical level, not an independent causal force, so its mere contact cannot guarantee direction. Confidence is moderate rather than high because the claim is compound (a specific magnitude of rebound plus a specific date range plus a specific catalyst), and each sub-claim is only weakly supported even on the affirmative's own statistics.
🔬 DeepResearch Result: likely FALSE ❌ (78%)
Assertion: There will be a significant rebound in memory chip stocks like SK Hynix on 2026-10-21 to 2026-10-25 due to the stock reaching its 200-day moving average .
Participating models: deepseek-v4-pro 💬, gemma-4-26b-a4b-it 💬👁️
📊 Face-offs: 0 concluded TRUE, 1 concluded FALSE (1 face-offs, 3 models)
📊 Score by side: TRUE=0.00, FALSE=0.90
🏅 Model score changes:
minimax-m3 💬👁️: +9
✅ PRO Arguments:
- ■The 200-day moving average is the most widely monitored long-term trend indicator , and when a high-beta , cyclically sensitive stock like SK Hynix declines into contact with its 200-day MA, a confluence of institutional buying pressure and quantitative/algorithmic trading systems creates a self-fulfilling support mechanism that historically produces rebounds. deepseek-v4-pro 💬
- ■Empirical data shows a ~72% rebound rate for SOX index after touching the 200-day MA, an 8–14% mean rebound range for SK Hynix in similar historical setups, and 60–70% of trading volume is algorithmic, which programmatically buys at the 200-day MA level. deepseek-v4-pro 💬
❌ ANTI Arguments:
- ■The affirmative commits a substitution error by using the behavior of aggregate global equity markets and institutional portfolio managers (entity E2) to predict the specific price action of SK Hynix (entity E1) without providing the required transfer operator such as beta, correlation , or cointegration that bridges the two entities. gemma-4-26b-a4b-it 💬👁️
- ■The affirmative is internally inconsistent: it simultaneously asserts a 'significant rebound' while its own evidence admits a historical probability of only ~72%, implying a ~28% failure rate that materially undermines the 'significant' claim for any specific future window. gemma-4-26b-a4b-it 💬👁️
- ■The 200-day MA touch is a correlation observation, not a causal mechanism; technical levels are descriptive summaries of past prices and do not generate independent buy/sell pressure, so treating the indicator as a deterministic rebound trigger is a logical fallacy. gemma-4-26b-a4b-it 💬👁️
💭 Reasoning: False, with moderate confidence, the assertion that SK Hynix will rebound specifically during October 21–25, 2026 because it reaches its 200-day moving average is not supported by the debate. The winning side demonstrated a fatal substitution error in the affirmative's argument: applying aggregate market behavior to a single security without a validated transfer operator (beta, correlation, or cointegration). The affirmative's own data concedes a ~28% failure rate, which is inconsistent with declaring a 'significant' rebound as a near-certain event for a precise five-day window. Furthermore, the 200-day MA is only a descriptive technical level, not an independent causal force, so its mere contact cannot guarantee direction. Confidence is moderate rather than high because the claim is compound (a specific magnitude of rebound plus a specific date range plus a specific catalyst), and each sub-claim is only weakly supported even on the affirmative's own statistics.
📋 PRO Facts:
• The 200-day moving average is widely monitored by institutional investors and algorithmic trading systems as a long-term trend indicator.
• Historical SOX index rebounds after touching the 200-day MA occurred at an approximate 72% rate according to the affirmative's cited data.
• SK Hynix's mean historical rebound range in similar 200-day MA setups was cited as 8–14%.
• Algorithmic trading volume was cited at 60–70% of total trading activity, with many systems programmed to buy at the 200-day MA level.
📋 ANTI Facts:
• A 72% historical rebound rate implies a ~28% failure rate, which contradicts a claim of a guaranteed or 'significant' rebound in a specific forward window.
• No transfer operator (beta, correlation, or cointegration) was provided to link aggregate-market 200-day MA behavior to SK Hynix's individual price action.
• Technical indicators such as the 200-day MA are descriptive summaries of past price data and are not independently causal mechanisms.
• The five-day window (Oct 21–25, 2026) is an arbitrary short period over which idiosyncratic news, earnings, or sector-specific catalysts can dominate any technical signal.
| Face-off | TRUE Model | FALSE Model | TRUE Avg μ | FALSE Avg μ | TRUE Tokens | FALSE Tokens | Winner | Verdict | Conf. |
|---|---|---|---|---|---|---|---|---|---|
| #1 | deepseek-v4-pro 💬 | gemma-4-26b-a4b-it 💬👁️ | 0.264 | 0.146 | 6 | 2 | TRUE | FALSE | 90% |
The following technical terms, abbreviations, and domain-specific concepts are referenced throughout this debate transcript. Numbers in square brackets [N] in the text above link to the corresponding entry below.
[1] 200-day moving average — 200-day MA — A long-term technical indicator calculated by averaging a security's closing prices over the previous 200 trading days, widely monitored by institutional investors as a benchmark for the prevailing long-term trend.
[2] aggregate market — The combined behavior of a broad universe of securities treated as a single entity, as distinct from the behavior of any individual constituent stock.
[3] algorithmic trading — The use of computer programs that automatically execute trades based on predefined rules, such as price levels, technical indicators, or statistical signals.
[4] base rate — The overall frequency or probability of an outcome across a population or sample, used as a reference point when evaluating specific predictions.
[5] beta — A measure of a stock's volatility relative to the overall market, indicating how much its price tends to move for a given move in the benchmark index.
[6] buy triggers — Predefined price levels or technical conditions programmed into trading algorithms that automatically generate purchase orders when met.
[7] cointegration — A statistical property describing two or more time series that move together over the long run, even if they diverge in the short term, used to model linked price behavior.
[8] correlation — A statistical measure of how two variables move in relation to each other, ranging from -1 (perfect inverse) to +1 (perfect positive).
[9] cyclically sensitive stock — An equity whose price and earnings tend to fluctuate significantly with the broader economic or industry cycle, such as semiconductor manufacturers.
[10] de facto floor — A price level that, while not a formal contractual or technical limit, effectively acts as a lower boundary due to widespread market behavior or expectations.
[11] deterministic claim — An assertion that a specific outcome will occur with certainty, as opposed to a probabilistic claim that assigns a likelihood to the outcome.
[12] discretionary institutional buying — Purchase decisions made by professional asset managers based on judgment and analysis, rather than by automated rules.
[13] equity markets — Markets in which shares of publicly listed companies are issued and traded.
[14] equity volume — The total number of shares traded in a given stock or across the market over a specified period.
[15] evidentiary framework — The structured set of facts, statistics, and reasoning used to support or refute a claim within an argument.
[16] high-beta — Describing a stock whose price movements are more volatile than the overall market, typically with a beta value greater than 1.
[17] institutional portfolio managers — Professional investors managing large pools of capital on behalf of institutions such as pension funds, mutual funds, and endowments.
[18] long-term trend indicator — A technical analysis tool, such as a long-period moving average, used to identify and confirm the prevailing direction of price movement over an extended horizon.
[19] mean rebound range — The average percentage price recovery observed following a defined trigger event, such as a touch of a moving average.
[20] memory chip stocks — Shares of companies whose primary business is the design or manufacture of memory semiconductors, such as DRAM and NAND flash.
[21] non-sequitur — A logical fallacy in which a conclusion does not follow from the premises presented, often because a required linking step is missing.
[22] price action — The movement of a security's price over time, often analyzed directly through charts without reliance on secondary indicators.
[23] probabilistic — Describing a statement or claim that expresses an outcome in terms of likelihood or probability rather than certainty.
[24] quantitative trading — Trading strategies that rely on mathematical models and statistical analysis to identify and execute trades.
[25] rebound — A recovery in price following a decline, often measured from a recent low or from a technical support level.
[26] self-fulfilling support mechanism — A price level such as a moving average that tends to hold because enough market participants act on the belief that it will hold, reinforcing the level through their collective buying.
[27] self-reinforcing bid — A wave of buying pressure that, once initiated, attracts additional buyers and amplifies the upward price movement.
[28] semiconductor stock — Equity in a company that designs or manufactures semiconductors, the foundational components of electronic devices.
[29] SOX — Philadelphia Semiconductor Index (PHLX Semiconductor Sector Index) — A capitalization-weighted index tracking the performance of the 30 largest U.S.-listed semiconductor companies, commonly used as a benchmark for the chip sector.
[30] strategic accumulation zone — A price region where institutional investors deliberately build positions, anticipating that the level will attract sufficient demand to produce a price recovery.
[31] substitution error — A logical fallacy in which evidence about one entity is used to support a conclusion about a different entity without establishing the required link between them.
[32] systematic algorithmic execution — The automated placement and management of trade orders by computer systems following predefined rules, without discretionary human intervention.
[33] technical indicators — Mathematical calculations based on price, volume, or open interest that traders use to forecast future price movements.
[34] trading window — A specified date range during which a particular trading activity, restriction, or forecast applies.
[35] transfer operator — In the context of this debate, the missing logical or statistical link (such as beta, correlation, or cointegration) required to extend a conclusion from an aggregate entity to a specific constituent.
The following financial data tables were referenced during the debate exchanges:
| Variable | Affirmative Assertion | Logical Status |
|---|---|---|
| Rebound Probability | 72% (for SOX constituents) | Unverifiable (No locator) |
| SK Hynix Mean Rebound | 8–14% | Unverifiable (No locator) |
| Algo Trading Volume | 60–70% | Unverifiable (No locator) |
Legend: Comparison of the affirmative's cited statistics against their evidentiary validity. All figures are provided by the opponent without primary source documentation.
Face-off transcripts
- ■
Ownership & Trade Secrets. The Company Lambda Vision retains all rights to its platform, agentic workflows, and proprietary financial methodologies, which constitute protected Trade Secrets (EU Directive 2016/943). Subject to full payment of credits, the User is granted ownership of the generated Reports for their own professional use. Reverse-engineering the Service or using Reports to train competing AI models is strictly prohibited.
- ■
No Financial Advice. The Service and Reports are for informational purposes only and do not constitute financial, investment, legal, or tax advice. The Company is not a regulated financial advisor. AI-generated outputs may contain errors; the User is solely responsible for verifying data and assumes all risks for any financial decisions or losses.
- ■
Liability & Governing Law. To the maximum extent permitted by law, the Company shall not be liable for any indirect or financial damages. These Terms are governed by French law. Any disputes shall be subject to the exclusive jurisdiction of the Courts of Paris, France.