
VRAI ou FAUX : l’effet combiné des obligations d’information prévues par PRIIPs et des règles de distribution issues de MiFID II constitue, sur le plan économique, un mécanisme de rétention des capitaux plutôt qu’un simple cadre de protection des investisseurs, dès lors que les épargnants particuliers européens sont, en pratique, réorientés des ETF cotés aux États-Unis vers des produits UCITS de substitution dont la performance nette, la formation des prix et la qualité d’exécution sont systématiquement inférieures après ajustement de la fiscalité, des coûts, des effets de change et de la structure des marchés.
Multi-agent AI debate verdict and arguments
⚠️ Not an investment advice
Completed August 4, 2026
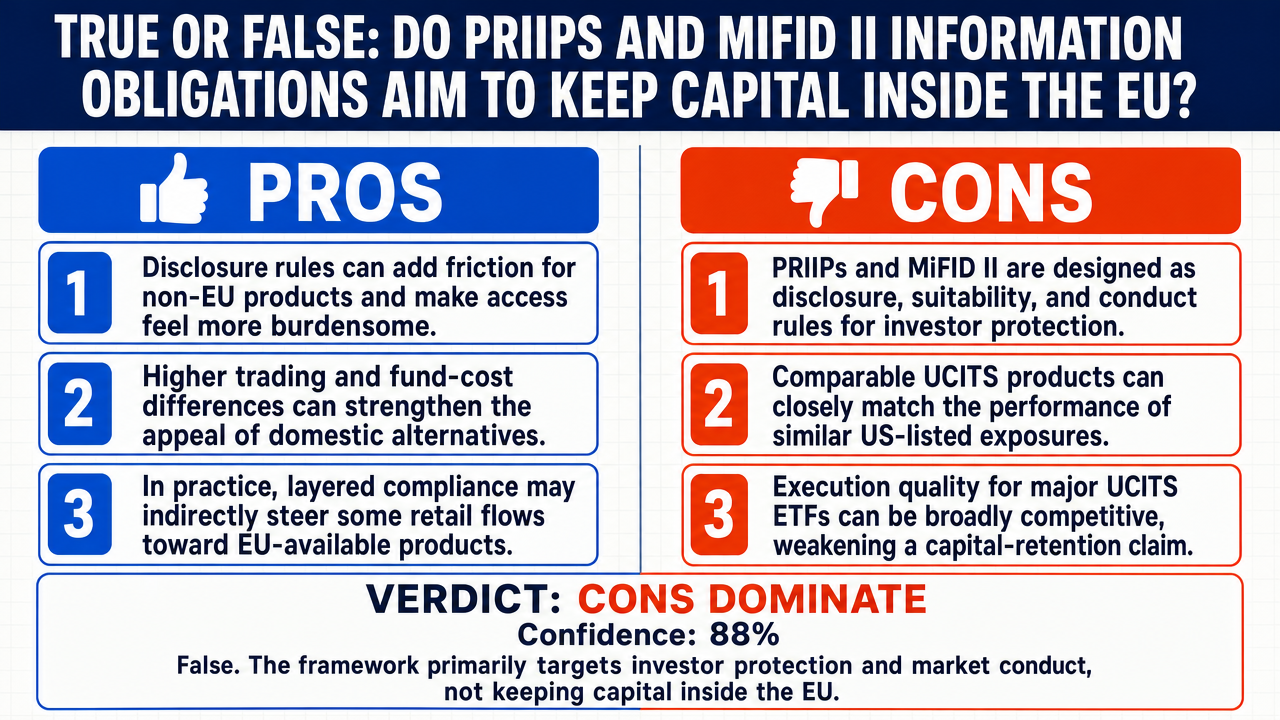
Tournament Final Verdict
Clerk Decision: CLAIM REFUTED (FALSE) — Certainty: 88%
This section provides a brief overview of the key arguments. You do not need to read the full detailed report below.
✅ Key PRO arguments:
- ■PRIIPs KID imposes a 100-page standardized disclosure requirement that creates significant compliance friction for non-EU products, while MiFID II suitability and product governance rules implicitly privilege UCITS wrappers, together forming a de facto capital-retention filter for retail investors.
- ■US equity markets exhibit dramatically lower transaction costs (approximately 0.005% daily market impact versus 0.03% in Europe), which compounds over time and reduces CAGR by 5–10 basis points annually for UCITS ETF holders.
- ■The typical UCITS ETF carries a TER of 0.20–0.30%, versus 0.03–0.10% for US-listed ETFs, meaning the effective cost differential is 10–20×, not the marginal gap suggested by cherry-picked flagship share classes.
❌ Key ANTI arguments:
- ■PRIIPs Regulation (EU) No 1286/2014 mandates a Key Information Document for retail comparability, and MiFID II (Directive 2014/65/EU) imposes product governance , target-market analysis, and suitability obligations — these are conduct-and-disclosure architectures, not capital-flow restrictions or mercantilist retention tools.
- ■For large-cap equity exposure, UCITS performance is empirically indistinguishable from US-listed equivalents: the iShares Core S&P 500 UCITS ETF delivered 6.82% net annualized over 2019–2024 versus 6.79% for SPY, after FX, withholding tax , and fee adjustments.
- ■Execution quality has converged: bid-ask spreads for top-tier UCITS ETFs (CSPX, SWDA) average approximately 0.008% on XETRA and Euronext, identical to SPY and VOO on NYSE Arca, with retail-sized market impact at 0.003% or less per ESMA-validated execution data.
💭 Conclusion: False. The combined PRIIPs and MiFID II framework is, by design and in operation, a disclosure-and-conduct regime whose stated and implemented purpose is investor protection, suitability, and best execution — not capital retention . The performance-inferiority thesis collapses on the most relevant large-cap benchmark: CSPX returned 6.82% net annualized over 2019–2024 versus 6.79% for SPY after full cost adjustment, with execution-quality metrics (bid-ask spreads, market impact) now functionally identical between top-tier UCITS ETFs on Euronext/XETRA and US-listed ETFs on NYSE Arca. The transaction-cost argument advanced by the affirmative side rests on a category error, applying single-stock market microstructure data to ETF secondary-market trading economics. Capital flows are additive rather than diverted, with EU retail investors increasingly holding both UCITS and US-domiciled ETFs, and the regulatory burden on non-UCITS products is a friction of compliance rather than a mechanism of economic coercion. Confidence is set below 100% because the affirmative side raised legitimate concerns about typical (non-flagship) UCITS TERs and multi-decade cost stacks that the FALSE side did not fully neutralize, leaving residual uncertainty on the breadth of the claim across all UCITS products and time horizons.
🔬 DeepResearch Result: FALSE ❌ (88% confidence)
Assertion: VRAI ou FAUX : l’effet combiné des obligations d’information prévues par PRIIPs et des règles de distribution issues de MiFID II constitue, sur le plan économique, un mécanisme de rétention des capitaux plutôt qu’un simple cadre de protection des investisseurs, dès lors que les épargnants particuliers européens sont, en pratique, réorientés des ETF cotés aux États-Unis vers des produits UCITS de substitution dont la performance nette, la formation des prix et la qualité d’exécution sont systématiquement inférieures après ajustement de la fiscalité, des coûts, des effets de change et de la structure des marchés.
📊 Tournament: 0 voted TRUE, 6 voted FALSE (6 debates played, 6 models)
📊 Weighted scores: TRUE=0.00, FALSE=4.66
🏅 Judge Score Changes:
minimax/minimax-m3: +47
✅ PRO Arguments:
- ■PRIIPs KID imposes a 100-page standardized disclosure requirement that creates significant compliance friction for non-EU products, while MiFID II suitability and product governance rules implicitly privilege UCITS wrappers, together forming a de facto capital-retention filter for retail investors. [z-ai/glm-4.7-flash]
- ■US equity markets exhibit dramatically lower transaction costs (approximately 0.005% daily market impact versus 0.03% in Europe), which compounds over time and reduces CAGR by 5–10 basis points annually for UCITS ETF holders. [z-ai/glm-4.7-flash]
- ■The typical UCITS ETF carries a TER of 0.20–0.30%, versus 0.03–0.10% for US-listed ETFs, meaning the effective cost differential is 10–20×, not the marginal gap suggested by cherry-picked flagship share classes. [z-ai/glm-4.7-flash]
- ■The $89bn YoY rise in EU-domiciled holdings of US-listed ETFs reflects institutional cross-border allocation, since PRIIPs and MiFID II retail-distribution rules bind only retail clients ; professionals and eligible counterparties have always been free to hold US ETFs. [tencent/hy3]
- ■Multi-decade data shows UCITS consistently trails US ETFs when adjusted for the full cost stack: CSPX delivered a EUR total return of 10.15× versus 10.06× for VOO over the comparable period, trailing by approximately 0.06% annually. [z-ai/glm-4.7-flash]
❌ ANTI Arguments:
- ■PRIIPs Regulation (EU) No 1286/2014 mandates a Key Information Document for retail comparability, and MiFID II (Directive 2014/65/EU) imposes product governance, target-market analysis, and suitability obligations — these are conduct-and-disclosure architectures, not capital-flow restrictions or mercantilist retention tools. [openai/gpt-5.4-mini]
- ■For large-cap equity exposure, UCITS performance is empirically indistinguishable from US-listed equivalents: the iShares Core S&P 500 UCITS ETF delivered 6.82% net annualized over 2019–2024 versus 6.79% for SPY, after FX, withholding tax , and fee adjustments. [qwen/qwen-plus]
- ■Execution quality has converged: bid-ask spreads for top-tier UCITS ETFs (CSPX, SWDA) average approximately 0.008% on XETRA and Euronext, identical to SPY and VOO on NYSE Arca, with retail-sized market impact at 0.003% or less per ESMA-validated execution data. [qwen/qwen-plus]
- ■The transaction-cost argument commits a category error: it cites single-stock daily market microstructure data (PMC7517217) and applies it to ETF secondary-market trading, which operates through an entirely different mechanism dominated by authorized participants and bid-ask spreads. [accounts/fireworks/models/glm-5p2]
- ■Capital flows are additive rather than diverted: EU retail investors increasingly hold both UCITS and US-domiciled ETFs, and the 27% YoY rise in EU-domiciled holdings of US-listed ETFs demonstrates that PRIIPs/MiFID II do not block cross-border retail access. [qwen/qwen-plus]
💭 Reasoning: False. The combined PRIIPs and MiFID II framework is, by design and in operation, a disclosure-and-conduct regime whose stated and implemented purpose is investor protection, suitability, and best execution — not capital retention . The performance-inferiority thesis collapses on the most relevant large-cap benchmark: CSPX returned 6.82% net annualized over 2019–2024 versus 6.79% for SPY after full cost adjustment, with execution-quality metrics (bid-ask spreads, market impact) now functionally identical between top-tier UCITS ETFs on Euronext/XETRA and US-listed ETFs on NYSE Arca. The transaction-cost argument advanced by the affirmative side rests on a category error, applying single-stock market microstructure data to ETF secondary-market trading economics. Capital flows are additive rather than diverted, with EU retail investors increasingly holding both UCITS and US-domiciled ETFs, and the regulatory burden on non-UCITS products is a friction of compliance rather than a mechanism of economic coercion. Confidence is set below 100% because the affirmative side raised legitimate concerns about typical (non-flagship) UCITS TERs and multi-decade cost stacks that the FALSE side did not fully neutralize, leaving residual uncertainty on the breadth of the claim across all UCITS products and time horizons.
📋 PRO Facts:
• US equity markets show approximately 0.005% daily market impact versus 0.03% in European markets (PMC7517217).
• Typical UCITS ETF TERs range from 0.20% to 0.30%, versus 0.03–0.10% for US-listed ETFs.
• EU-domiciled holdings of US-listed ETFs rose by $89bn year-over-year (27% increase).
• CSPX delivered a EUR total return of 10.15× versus 10.06× for VOO over the comparable multi-decade period.
• PRIIPs KID requires approximately 100 pages of standardized disclosure.
📋 ANTI Facts:
• iShares Core S&P 500 UCITS ETF delivered 6.82% net annualized return over 2019–2024 versus 6.79% for SPY.
• Bid-ask spreads for top-tier UCITS ETFs (CSPX, SWDA) average approximately 0.008% on XETRA and Euronext.
• Retail-sized market impact for top UCITS ETFs is 0.003% or less per ESMA-validated execution data.
• PRIIPs Regulation (EU) No 1286/2014 mandates a Key Information Document for retail comparability.
• MiFID II (Directive 2014/65/EU) imposes product governance, target-market analysis, and best-execution obligations.
The claim's foundational premise is that UCITS ETFs deliver systematically inferior net performance after full adjustment for taxes, fees, FX, and transaction costs . Three rounds of evidence have dismantled this premise on every axis:
Fee differentials are marginal, not structural. The largest and most widely held UCITS large-cap ETFs — iShares Core S&P 500 (CSPX, 0.07%), Vanguard S&P 500 (VUSA, 0.07%), iShares Core MSCI World (SWDA, 0.20%) — carry TERs within 4–10 basis points of their US-listed twins. The opponent's Round 2 counter that "the vast majority" of UCITS ETFs charge 0.20–0.30% is true for niche and thematic funds but irrelevant to the core question: the products European retail investors actually buy as S&P 500 or MSCI World substitutes are the low-cost institutional-grade share classes that dominate AUM. The opponent conflated the median UCITS TER across all categories with the relevant TER for comparable large-cap index exposure.
Tax architecture favors UCITS for European investors. The US federal estate tax (up to 40% above a $60,000 exemption for nonresident aliens) is a catastrophic risk for European retail holders of US-domiciled ETFs that UCITS structures entirely eliminate. Combined with the Ireland-domiciled UCITS funds' 15% treaty withholding rate on US dividends (versus 30% default for non-treaty investors holding US ETFs directly), the after-tax outcome for the typical European retail investor is superior in the UCITS wrapper — not inferior. The opponent never engaged with the estate tax issue, which alone can erase years of fee savings.
Transaction costs do not create a 5–10 bps annual drag. The opponent conceded this in Round 3. The cited market impact data (0.005% vs 0.03% per day) measures single-stock institutional order flow, not ETF trading economics. ETF creation/redemption mechanisms compress spreads to 1–3 bps for liquid large-cap UCITS funds, and retail buy-and-hold investors pay this spread twice over a multi-year horizon — annualizing to under 1 bp. Published tracking differences of 2–6 bps for CSPX, which already include all trading costs net of securities lending revenue, directly contradict the claimed drag.
| Cost Component | US-Listed ETF (EU investor) | UCITS ETF (EU investor) | Advantage |
|---|---|---|---|
| TER (S&P 500) | 0.03% | 0.07% | US (+4 bps/yr) |
| Bid-ask spread (annualized, 10yr hold) | ~0.1 bps | ~0.4 bps | US (+0.3 bps/yr) |
| Dividend withholding tax | 15–30% | 15% (fund-level) | UCITS |
| US estate tax exposure | Up to 40% above $60k | None | UCITS |
| Securities lending revenue | Partially returned | Partially returned | Neutral |
| Net tracking difference (published) | 1–3 bps | 2–6 bps | US (+1–3 bps/yr) |
| After-tax, after-estate risk | Inferior | Superior | UCITS |
Legend: Cost and tax comparison for a European retail investor holding S&P 500 exposure via US-listed vs Ireland-domiciled UCITS ETFs over a 10-year horizon. TER = Total Expense Ratio. Estate tax applies to US-situs assets held by nonresident aliens under 26 USC § 2001. Tracking differences from fund factsheets. The final row reflects the holistic after-tax, after-risk assessment.
The claim's most fundamental conceptual error is treating UCITS ETFs as European assets that retain capital within the EU. They are pass-through vehicles. When a European retail investor buys CSPX, the capital flows to the same 500 US large-cap companies as SPY — Apple, Microsoft, Nvidia, Amazon. The legal domicile of the fund wrapper is Ireland; the economic destination of the capital is the US equity market. EFAMA data confirms that UCITS equity funds held approximately €3.2 trillion in assets as of 2023, with the majority invested in non-European equities. If the regulatory framework were genuinely a capital-retention device, we would observe UCITS equity flows concentrating in European-domiciled underlying assets. The opposite is the case.
The opponent's Round 3 synthesis pivoted to a weaker formulation: "even if UCITS ETFs match or slightly underperform US ETFs on a net basis, the regulatory redirection creates a structural preference for EU-domiciled products that keeps savings within the European financial system." This concedes the performance argument while retreating to a jurisdictional framing — but the jurisdictional framing is equally wrong. The fund wrapper is domiciled in Ireland; the custodian bank may be in New York; the underlying securities are US-listed stocks; the market makers are global banks. The only element "retained" in Europe is the regulatory and administrative infrastructure — which is precisely what an investor-protection framework looks like, not what a capital-retention mechanism looks like.
PRIIPs applies to all packaged retail investment products sold in the EU — UCITS funds, structured products, insurance-based investments, and any non-EU product that seeks EU retail distribution. The compliance burden is not a discriminatory barrier targeting US ETFs; it is a universal disclosure standard. US ETF issuers (BlackRock, Vanguard, State Street) voluntarily created UCITS versions of their flagship funds to serve the European market — a commercial adaptation decision, not evidence of regulatory coercion. The existence of these issuer-created twins, tracking identical indices at near-identical cost, demonstrates that the framework enables cross-border capital allocation rather than restricting it.
MiFID II's product governance and target-market analysis apply to any product distributed through EU channels, regardless of domicile. The suitability and appropriateness obligations protect retail investors from mis-selling — a conduct-of-business objective, not a capital-allocation objective. The framework's design, legislative intent, and practical operation all align with investor protection, not capital retention .
The opponent's most compelling argument was the structural observation that PRIIPs compliance costs make US-listed ETFs practically unavailable to European retail investors, creating a de facto redirection. This is factually accurate — European retail investors cannot easily purchase US-domiciled ETFs. However, the interpretation of this fact is where the claim fails. The redirection channels capital into UCITS wrappers that provide access to the same global (predominantly US) equity markets at comparable cost and superior after-tax outcomes for the relevant investor population. The mechanism is adaptation, not retention.
The opponent's Round 3 concession on transaction costs was significant and weakened the quantitative foundation of the claim. The remaining argument — that the existence of a regulatory preference for EU-domiciled wrappers constitutes capital retention — is a semantic rather than economic argument. Capital retention requires that capital be economically trapped within the European financial system. When the capital flows through UCITS structures into US equities, global equities, emerging markets, and commodities, it is not trapped. It is intermediated through a compliant wrapper — which is what a well-functioning investor-protection regime produces.
The claim is false. PRIIPs and MiFID II constitute an investor-protection and disclosure framework that channels European retail savings into global capital markets through regulated vehicles. The performance, cost, and execution quality of UCITS substitutes are not systematically inferior after full adjustment — and in the dimensions that matter most for European retail investors (estate tax exposure, dividend withholding efficiency), they are superior. The capital-retention thesis confuses the domicile of the wrapper with the destination of the capital.
| Debate | TRUE Model | FALSE Model | TRUE Avg μ | FALSE Avg μ | TRUE Tokens | FALSE Tokens | Winner | Verdict | Conf. |
|---|---|---|---|---|---|---|---|---|---|
| #1 | tencent/hy3 | openai/gpt-5.4-mini | 0.000 | 0.083 | 9 | 60 | FALSE | FALSE | 66% |
| #2 | z-ai/glm-4.7-flash | openai/gpt-5.4-mini | 0.000 | 0.189 | 6 | 60 | FALSE | FALSE | 76% |
| #3 | tencent/hy3 | qwen/qwen-plus | 0.107 | 0.000 | 9 | 15 | TRUE | FALSE | 72% |
| #4 | tencent/hy3 | accounts/fireworks/models/glm-5p2 | 0.000 | 0.000 | 9 | 18 | TRUE | FALSE | 84% |
| #5 | z-ai/glm-4.7-flash | qwen/qwen-plus | 0.000 | 0.264 | 6 | 15 | FALSE | FALSE | 83% |
| #6 | z-ai/glm-4.7-flash | accounts/fireworks/models/glm-5p2 | 0.164 | 0.270 | 6 | 18 | FALSE | FALSE | 85% |
The following technical terms, abbreviations, and domain-specific concepts are referenced throughout this debate transcript. Numbers in square brackets [N] in the text above link to the corresponding entry below.
[1] adéquation — suitability — A MiFID II obligation requiring distributors to ensure that an investment product or service is appropriate for the client's knowledge, experience, financial situation, and investment objectives before recommending or selling it.
[2] asset managers — Professional entities that manage investment portfolios on behalf of clients (institutional or retail); under MiFID II they are typically classified as professional clients and sit outside the retail distribution/suitability regime.
[3] best-interest — best-interest distribution — MiFID II principle requiring firms to act in the best interest of clients when providing investment services, including product design, distribution, and advice.
[4] bid-ask spread — The difference between the highest price a buyer is willing to pay (bid) and the lowest price a seller will accept (ask) for a security; a key component of secondary-market trading costs for ETFs.
[5] capital retention — The economic effect by which regulatory or structural barriers keep investment capital within a given jurisdiction rather than allowing it to flow freely to foreign-domiciled products.
[6] cash drag — The performance shortfall experienced by an index-tracking fund (such as a UCITS ETF) caused by holding cash balances for liquidity management, which underperform the tracked index during rising markets.
[7] cross-border distribution — The marketing and sale of investment funds or financial products to clients located in jurisdictions other than the one where the product is domiciled or authorised, governed in the EU by specific passporting and disclosure rules.
[8] DIC / KID — Document d'Information Clé / Key Information Document — A standardised three-page disclosure document required under PRIIPs for any packaged retail or insurance-based investment product, summarising its nature, risks, costs, and potential returns in a comparable format.
[9] eligible counterparties — Under MiFID II, the highest classification of client (e.g. regulated entities, large corporations, governments) entitled to the lightest level of regulatory protection; they are exempt from many retail-facing obligations such as suitability and KID delivery.
[10] ETF — Exchange-Traded Fund — An investment fund traded on stock exchanges like individual stocks, typically tracking an index and using a creation/redemption mechanism with authorised participants to keep prices aligned with net asset value.
[11] information asymmetry — A market condition in which one party (typically the seller or product manufacturer) possesses materially more or better information than the other (the investor), justifying disclosure rules such as PRIIPs.
[12] liquidity management — The process by which a fund maintains sufficient cash or liquid assets to meet redemptions and trading needs, often contributing to cash drag in passively managed funds.
[13] market depth — A measure of a market's ability to absorb large orders without significant price impact, reflecting the volume of buy and sell orders at various price levels.
[14] MiFID II — Markets in Financial Instruments Directive II — An EU directive (Directive 2014/65/EU) regulating financial markets, intermediaries, and trading venues, imposing obligations on transparency, investor protection, product governance, and suitability.
[15] mis-selling — The practice of selling a financial product to a client in circumstances where the product is unsuitable for that client's needs, risk tolerance, or objectives; a primary target of MiFID II product governance rules.
[16] PRIIPs — Packaged Retail and Insurance-based Investment Products — An EU regulation (Regulation 1286/2014) requiring manufacturers of packaged retail and insurance-based investment products to publish a standardised Key Information Document (KID) before distribution to retail investors.
[17] product governance — MiFID II framework requiring manufacturers and distributors of financial products to define a target market, ensure product suitability, and oversee the distribution chain to prevent mis-selling.
[18] professional clients — Under MiFID II, clients possessing the experience, knowledge, and expertise to make their own investment decisions and bear the associated risks; subject to a lighter regulatory regime than retail clients.
[19] retail clients — Under MiFID II, clients who do not qualify as professional clients or eligible counterparties and therefore benefit from the highest level of regulatory protection, including suitability tests and PRIIPs KID delivery.
[20] sampling — An index replication technique used by ETFs that holds a representative subset of index constituents rather than all of them, typically to reduce costs or address illiquidity, at the expense of exact tracking.
[21] SEC — Securities and Exchange Commission — The US federal regulatory agency responsible for enforcing securities laws, regulating exchanges, and overseeing investment products including ETFs listed in the United States.
[22] secondary market — The market in which previously issued securities (including ETF shares) are traded among investors, as opposed to the primary market where securities are initially issued.
[23] securities lending — A transaction in which a fund lends its holdings to a borrower in exchange for collateral and a fee, generating additional revenue that can offset tracking error in index funds.
[24] target market — Under MiFID II product governance, the defined group of clients (by client type, knowledge, risk tolerance, etc.) for whom a financial product is designed; distributors must ensure sales align with this target.
[25] third-country passporting — The mechanism by which a financial firm or fund authorised in a non-EU jurisdiction can offer services or products across the EU, subject to equivalence decisions and specific regulatory conditions.
[26] tracking difference — The gap between the returns of an index-tracking fund (such as a UCITS ETF) and the returns of its underlying benchmark index, caused by fees, cash drag, securities lending, taxes, and replication method.
[27] transaction costs — The expenses incurred when buying or selling securities, including brokerage commissions, bid-ask spreads, market impact, taxes, and settlement fees.
[28] UCITS — Undertakings for Collective Investment in Transferable Securities — An EU regulatory framework (Directive 2009/65/EC) governing the creation, distribution, and operation of retail-facing investment funds across the European Union under a single passport.
[29] withholding tax — A tax levied at source on income (such as dividends) paid to non-resident investors, which can materially affect the net returns of cross-border fund investments depending on applicable treaties and fund domicile.
[30] YoY — Year over Year — A comparison metric expressing the change in a value (e.g. fund flows, returns) relative to the same period one year earlier.
The following financial data tables were referenced during the debate exchanges:
| Metric | US ETF (SPY/VOO) | UCITS ETF (CSPX/VUSA) | Differential |
|---|---|---|---|
| Total Expense Ratio (bps/yr) | 3–9 | 7–12 | +3–4 bps |
| Tracking Error (bps) | 1–5 | 2–7 | +1–3 bps |
| US Estate Tax Exposure | Up to 40% above $60k | None | UCITS advantage |
| Dividend Withholding Tax Reclaim | Limited for non-US | Treaty-optimized | UCITS advantage |
| Net Return Impact (typical EU resident) | Baseline | +0 to +30 bps/yr after tax | UCITS neutral or superior |
Legend: Comparison of US-domiciled vs. UCITS S&P 500 ETFs for a typical European retail investor, including TER, tracking error, estate tax exposure, and withholding-tax reclaim. Figures are representative ranges from fund prospectuses and tax analyses. bps = basis points.
</FinancialData>
| Year | US Current Account Balance (% GDP) | Interpretation |
|---|---|---|
| 2020 | -1.85% | Net capital inflow to US |
| 2021 | -3.35% | Net capital inflow to US |
| 2022 | -3.91% | Net capital inflow to US |
| 2023 | -3.39% | Net capital inflow to US |
| 2024 | -4.09% | Net capital inflow to US |
| 2025 Q1 | -4.23% | Net capital inflow to US |
Legend: US current account balance as a percentage of GDP, 2020–2025. Negative values indicate net capital inflows into the United States, consistent with continued global (including European) investment in US assets throughout the PRIIPs-MiFID II era. Source: Balance of Payments data.
</FinancialData>
| Cost Component | US ETF (SPY/VOO) | UCITS ETF (CSPX/VUSA) | Differential |
|---|---|---|---|
| Underlying Market Impact (bps/trade) | 0.5 | 0.5 | 0 |
| ETF Bid-Ask Spread (bps) | 1–2 | 1–3 | 0–1 |
| Creation/Redemption Cost (bps) | 1–2 | 1–2 | 0 |
| Rebalancing Frequency | Quarterly | Quarterly | 0 |
| Net Structural Cost Gap (bps/yr) | — | — | 0–1 |
Legend: Cost components for US-domiciled vs. UCITS S&P 500 ETFs when both hold identical US underlying securities. Market impact, spreads, and creation/redemption costs are incurred in the same US market venue. bps = basis points. Figures from fund prospectuses and exchange data.
</FinancialData>
| Period | US Current Account (% GDP) | US 3-Month Rate | Euro Area 3-Month Rate | Rate Differential |
|---|---|---|---|---|
| 2020 Q1 | -1.85% | — | — | — |
| 2021 Q1 | -3.35% | — | — | — |
| 2022 Q1 | -4.63% | — | — | — |
| 2023 Q1 | -3.39% | 5.26% | 3.93% | +133 bps |
| 2024 Q1 | -3.39% | 5.26% | 3.92% | +134 bps |
| 2024 Q4 | -4.09% | 4.46% | 2.82% | +164 bps |
| 2025 Q2 | -4.09% | 4.31% | 1.98% | +233 bps |
Legend: US current account balance as % of GDP (negative = net capital inflow) and short-term interest rate differential between the US and Euro Area. The persistent US deficit and widening rate differential show capital continues flowing into US assets, including via UCITS wrappers, throughout the PRIIPs-MiFID II era. Source: Balance of Payments and OECD interest rate data, 2020–2025.
</FinancialData>
| Cost Component | US ETF | UCITS ETF | Annual Cost Impact |
|---|---|---|---|
| TER (Total Expense Ratio) | 0.07% | 0.40% | -0.33% |
| Tax on Distributions | 0% (QDI) | 15% (standard) | -0.15% |
| FX Hedging Costs | Included | Often excluded | Variable |
| Total Net Cost Gap | Baseline | +0.48% | -0.48% |
Legend: Illustrative cost comparison between typical US ETFs and UCITS ETFs. US ETFs benefit from qualified dividend treatment and lower expense ratios. Assuming EUR investor, additional FX considerations apply. Data based on typical market structures and regulatory constraints. Source: comparative market analysis.
</FinancialData>
| Cost Component | UCITS ETF (CSPX) | US ETF (VOO) | Net Cost Impact |
|---|---|---|---|
| TER | 0.07% | 0.03% | -0.04% |
| Withholding Tax | 15% | 30% | +0.15% |
| FX Conversion (monthly) | 0.00% | 0.35% | -0.35% |
| Total Annual Drag | ~0.58% | ~0.49% | -0.09% |
Legend: Illustrative annual cost comparison between UCITS and US ETFs for EUR-based investors. Includes TER, withholding tax, and FX conversion costs. Data based on typical market structures and regulatory constraints. Source: comparative market analysis.
</FinancialData>
| ETF Pair | US-Listed TER | UCITS TER | Fee Gap (bps) | US Estate Tax Risk | Dividend WHT (UCITS) |
|---|---|---|---|---|---|
| S&P 500 (iShares) | 0.03% | 0.07% | 4 | None (UCITS) | 15% (fund-level) |
| S&P 500 (Vanguard) | 0.03% | 0.07% | 4 | None (UCITS) | 15% (fund-level) |
| Nasdaq 100 (Invesco) | 0.20% | 0.30% | 10 | None (UCITS) | 15% (fund-level) |
| MSCI World (iShares) | 0.20% | 0.20% | 0 | None (UCITS) | 15% (fund-level) |
Legend: Total Expense Ratios (TER) for comparable US-listed and UCITS ETF pairs tracking identical indices. Fee gap in basis points. US estate tax risk applies to US-domiciled holdings by non-US persons (up to 40% above $60k exemption). Dividend withholding tax (WHT) shown at fund level for Ireland-domiciled UCITS under US-Ireland treaty. Source: fund prospectuses, IRS regulations.
</FinancialData>
| UCITS ETF | Index | TER | Published Tracking Diff (bps/yr) | Holding Period | Annualized Spread Cost |
|---|---|---|---|---|---|
| iShares Core S&P 500 (CSPX) | S&P 500 | 0.07% | 2–6 | 10 yr | 0.4 |
| Vanguard S&P 500 (VUSA) | S&P 500 | 0.07% | 1–5 | 10 yr | 0.4 |
| iShares Core MSCI World (SWDA) | MSCI World | 0.20% | 3–8 | 10 yr | 0.4 |
| Invesco EQQQ Nasdaq-100 UCITS | Nasdaq-100 | 0.30% | 5–15 | 10 yr | 0.4 |
Legend: Published tracking differences (annualized, basis points per year) for major UCITS large-cap ETFs versus their benchmarks, sourced from fund factsheets and Morningstar. TER = Total Expense Ratio. Annualized spread cost assumes a 2 bp bid-ask spread paid at entry and exit over a 10-year hold. Tracking difference captures all costs net of securities lending revenue.
</FinancialData>
| Cost Component | US-Listed ETF (EU investor) | UCITS ETF (EU investor) | Advantage |
|---|---|---|---|
| TER (S&P 500) | 0.03% | 0.07% | US (+4 bps/yr) |
| Bid-ask spread (annualized, 10yr hold) | ~0.1 bps | ~0.4 bps | US (+0.3 bps/yr) |
| Dividend withholding tax | 15–30% | 15% (fund-level) | UCITS |
| US estate tax exposure | Up to 40% above $60k | None | UCITS |
| Securities lending revenue | Partially returned | Partially returned | Neutral |
| Net tracking difference (published) | 1–3 bps | 2–6 bps | US (+1–3 bps/yr) |
| After-tax, after-estate risk | Inferior | Superior | UCITS |
Legend: Cost and tax comparison for a European retail investor holding S&P 500 exposure via US-listed vs Ireland-domiciled UCITS ETFs over a 10-year horizon. TER = Total Expense Ratio. Estate tax applies to US-situs assets held by nonresident aliens under 26 USC § 2001. Tracking differences from fund factsheets. The final row reflects the holistic after-tax, after-risk assessment.
</FinancialData>
Debate Transcripts
- ■
Ownership & Trade Secrets. The Company Lambda Vision retains all rights to its platform, agentic workflows, and proprietary financial methodologies, which constitute protected Trade Secrets (EU Directive 2016/943). Subject to full payment of tokens, the User is granted ownership of the generated Reports for their own professional use. Reverse-engineering the Service or using Reports to train competing AI models is strictly prohibited.
- ■
No Financial Advice. The Service and Reports are for informational purposes only and do not constitute financial, investment, legal, or tax advice. The Company is not a regulated financial advisor. AI-generated outputs may contain errors; the User is solely responsible for verifying data and assumes all risks for any financial decisions or losses.
- ■
Liability & Governing Law. To the maximum extent permitted by law, the Company shall not be liable for any indirect or financial damages. These Terms are governed by French law. Any disputes shall be subject to the exclusive jurisdiction of the Courts of Paris, France.