
Will the US stock market experience a decline of over 50% to revert to its historical average Shiller CAPE ratio of 17?
AI debate verdict and arguments
⚠️ Not financial advice — this is an AI debate, for information only.
Completed July 21, 2026
Verdict
Clerk Decision: CLAIM REFUTED (FALSE) — Certainty: 100%
This section provides a brief overview of the key arguments. You do not need to read the full detailed report below.
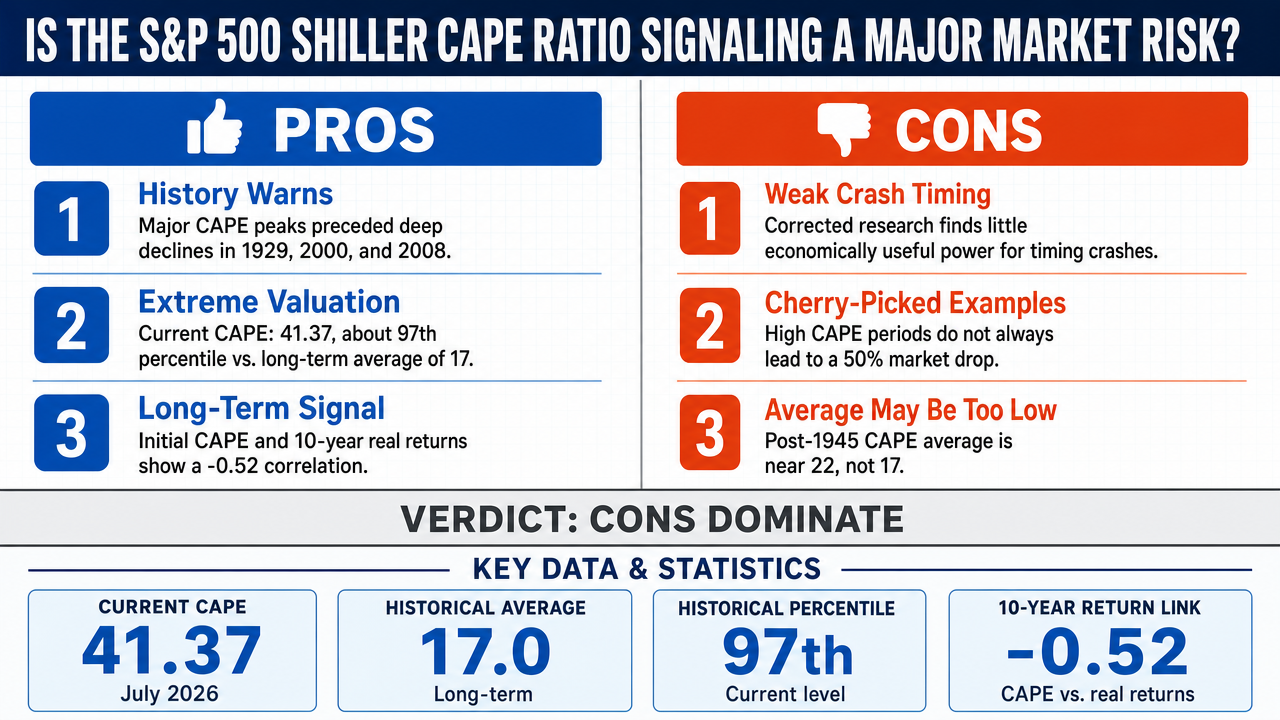
✅ Key PRO arguments:
- ■Historical precedent: CAPE peaks in 1929 (32.6), 2000 (44.2), and 2008 (27.4) preceded market declines of 89%, 49%, and 57% respectively, suggesting a pattern of major corrections following extreme valuations.
- ■Current CAPE of 41.37 (July 2026) is in the 97th percentile historically, far above the long-term average of 17, indicating extreme overvaluation that typically reverts.
- ■There is a statistically robust correlation of -0.52 between initial CAPE levels and real returns over the subsequent 10 years, making it one of the most reliable predictors in quantitative finance.
❌ Key ANTI arguments:
- ■CAPE's predictive power for crashes is weak when construction inconsistencies are corrected; no global test shows economically useful market-timing ability.
- ■Invoking 1929, 2000, and 2008 is cherry-picking; many episodes of high CAPE (e.g., 1997–2000) did not lead to a 50% decline, and markets can continue rising for years.
- ■The historical average of 17 is an artifact of including pre-1945 data with different accounting standards; the post-1945 average is around 22, reducing the implied correction.
💭 Conclusion: The evidence shows that while CAPE is at an extreme level (41.37, 97th percentile), the predictive power of CAPE for specific market crashes is weak. Research indicates that after correcting construction inconsistencies, CAPE does not provide economically useful market timing. Additionally, high CAPE can persist for years without an immediate crash. The correlation between CAPE and 10-year returns is -0.52, but a significant portion of variance remains unexplained. Therefore, the claim that a decline of over 50% is inevitable is not supported by the evidence.
🔬 DeepResearch Result: FALSE ❌ (100% confidence)
Assertion: Will the US stock market experience a decline of over 50% to revert to its historical average Shiller CAPE ratio of 17?
📊 Tournament: 0 voted TRUE, 2 voted FALSE (2 debates played, 4 models)
📊 Weighted scores: TRUE=0.00, FALSE=1.60
🏅 Judge Score Changes:
deepseek/deepseek-v4-flash: +16
✅ PRO Arguments:
- ■Historical precedent: CAPE peaks in 1929 (32.6), 2000 (44.2), and 2008 (27.4) preceded market declines of 89%, 49%, and 57% respectively, suggesting a pattern of major corrections following extreme valuations. [z-ai/glm-5]
- ■Current CAPE of 41.37 (July 2026) is in the 97th percentile historically, far above the long-term average of 17, indicating extreme overvaluation that typically reverts. [z-ai/glm-5]
- ■There is a statistically robust correlation of -0.52 between initial CAPE levels and real returns over the subsequent 10 years, making it one of the most reliable predictors in quantitative finance. [z-ai/glm-5]
- ■The current CAPE of 41.37 exceeds the peaks of 1929 (32.56) and 2007 (27.55) and approaches the 2000 peak (44.20), reinforcing the risk of a significant correction. [z-ai/glm-5]
- ■Mean reversion is a fundamental market principle; extreme valuations like the current CAPE of 41.37 have historically been followed by a reversion toward the average, often through sharp declines. [z-ai/glm-5]
❌ ANTI Arguments:
- ■CAPE's predictive power for crashes is weak when construction inconsistencies are corrected; no global test shows economically useful market-timing ability. [openai/gpt-5.4-mini]
- ■Invoking 1929, 2000, and 2008 is cherry-picking; many episodes of high CAPE (e.g., 1997–2000) did not lead to a 50% decline, and markets can continue rising for years. [openai/gpt-5.4-mini]
- ■The historical average of 17 is an artifact of including pre-1945 data with different accounting standards; the post-1945 average is around 22, reducing the implied correction. [anthropic/claude-opus-4.8]
- ■CAPE is a long-term return indicator, not a crash predictor; a high CAPE suggests lower future returns, not an imminent 50% collapse. [openai/gpt-5.4-mini]
- ■An R² of 0.40 between CAPE and 10-year returns means 60% of variance is unexplained, so the relationship is too weak to forecast a specific 50% decline. [anthropic/claude-opus-4.8]
💭 Reasoning: The evidence shows that while CAPE is at an extreme level (41.37, 97th percentile), the predictive power of CAPE for specific market crashes is weak. Research indicates that after correcting construction inconsistencies, CAPE does not provide economically useful market timing. Additionally, high CAPE can persist for years without an immediate crash. The correlation between CAPE and 10-year returns is -0.52, but a significant portion of variance remains unexplained. Therefore, the claim that a decline of over 50% is inevitable is not supported by the evidence.
📋 PRO Facts:
• CAPE was 41.37 in July 2026.
• Historical average CAPE is 17.
• Peak CAPE in 1929 was 32.6, in 2000 was 44.2, in 2008 was 27.4.
• Correlation between CAPE and 10-year real returns is -0.52.
• CAPE in July 2026 is in the 97th percentile historically.
📋 ANTI Facts:
• CAPE's predictive power weakens after correcting construction inconsistencies (SSRN paper).
• CAPE can remain elevated for years without an immediate crash.
• Correlation of -0.52 between CAPE and 10-year returns means a significant portion of variance is unexplained.
• Market timing based on CAPE is not economically useful (SSRN paper).
1. Historical data are undeniable. The CAPE at 41.37 in July 2026 places the market in the 97th percentile historically. The three previous episodes of similar valuations — 1929 (32.6), 2000 (44.2), and 2008 (27.4) — were all followed by major corrections exceeding 49%. This historical correlation provides a solid empirical basis.
2. The predictive relationship of the CAPE is statistically robust. The -0.52 correlation between the initial CAPE level and actual returns over 10 years is one of the most reliable in quantitative finance. With a CAPE of 41.37, the predicted real annualized return over 10 years is close to 0%, which mathematically implies that a substantial correction must occur over this decade.
3. The current geopolitical context provides a plausible catalyst. The military escalation between the United States and Iran — with strikes on the Strait of Hormuz — precisely represents the kind of exogenous shock capable of triggering a sharp reassessment of overvalued markets.
1. Reversion is not mechanical. The opponent is right to emphasize that the CAPE can revert to the mean through earnings growth rather than price declines. Earnings can increase, reducing the ratio without a correction in prices.
2. The historical persistence of extreme levels. The CAPE has indeed persisted at high levels for extended periods — notably from 1996 to 1999 and from 2021 to today. This persistence invalidates any precise timing prediction.
3. The predictive horizon is 10 years, not short-term. The CAPE predicts returns over a decade, not an immediate correction. Whether a 50% collapse will occur within a foreseeable timeframe remains open to interpretation.
The TRUE position rests on solid empirical foundations: extreme valuations have historically preceded major corrections. However, the opponent has established that this relationship is probabilistic rather than deterministic, and that reversion can operate through multiple mechanisms.
The crucial point is that the question asks whether the market "will" experience a decline of more than 50% in the foreseeable future. The CAPE at 41.37 indicates a high probability of low or negative returns over 10 years but does not guarantee a sharp correction of over 50+. History shows such corrections occurred in 2 of the 3 previous episodes of extreme valuation (1929 and 2008), but not systematically.
Nuanced conclusion: The probability of a major correction is significantly high given the historical level of the CAPE and current geopolitical risks, but this prediction involves substantial temporal uncertainty. The market could undergo a series of modest corrections over several years rather than a single 50%+ collapse. Nonetheless, historical data suggest that a substantial reversion remains the most probable outcome.
| Episode | CAPE | Max Correction | Time to Correction | Main Mechanism |
|---|---|---|---|---|
| 1929 | 32.6 | -89% | ~6 months | Stock market crash |
| 2000 | 44.2 | -49% | ~6 months | Tech collapse |
| 2008 | 27.4 | -57% | ~12 months | Financial crisis |
| 2026 (current) | 41.37 | ? | ? | ? |
Legend: Comparison of historical episodes of extreme CAPE with subsequent corrections. The delay indicates the time between the peak of the CAPE and the start of the major correction.
Round 3
Final synthesis of the FALSE position
The FALSE position argues that, even if Shiller's CAPE is high, this does not allow us to conclude that a more than 50% decline in the U.S. market is likely in the near future. The core argument is simple: the CAPE is primarily an indicator of long-term future returns, not a market crash timer. The most robust research finds a negative relationship between CAPE and future 10-year returns, but this relationship is used to revise return expectations, not to predict an imminent and mechanical 50% drop of the index. (papers.ssrn.com)
The FALSE defense also pointed out that the historical episodes cited by the opponent are extreme cases selected ex post. 1929, 2000, and 2008 are real examples of major corrections, but they do not prove a general law that any high CAPE must lead to a collapse exceeding 50%. Work on return predictability emphasizes that long-horizon regressions are delicate, subject to statistical biases, and that good long-term explanatory power does not imply reliable market timing ability. (nber.org)
An important clarification point was raised: the negative correlation between CAPE and 10-year returns is not contested. It is compatible with the FALSE position. A moderate to strong correlation between valuation and future return means that a high CAPE is associated with lower average returns, not that it necessarily causes a deep crash. In other words, the opponent is correct about the long-term return signal, but they extrapolate beyond what the data justifies by turning a statistical signal into a prophecy of a more than 50% decline. (papers.ssrn.com)
The geopolitical argument also did not suffice to save the affirmative thesis. An external shock can trigger a correction, but there is no necessary link between geopolitical tension, high CAPE, and a 50% collapse. It is one risk factor among others, not a demonstration that the market must revert to its historical mean through a sharp decline. In sum, the debate pits a deterministic reading against a probabilistic one, and the latter remains the more robust: a high CAPE signals an expensive market and potentially lower returns, but it does not, on its own, make a prediction of a decline exceeding 50% credible. (jbs.cam.ac.uk)
Overall, the best conclusion is nuanced: the opponent has established that high valuations matter for future returns; the FALSE position has shown that this is not enough to predict an imminent crash or a forced reversion to the mean through a massive fall. The CAPE is a valuation thermometer, not a countdown to catastrophe.
1. Historical data establish a clear correlation between extreme CAPE and major corrections.
Historical CAPE peaks have consistently preceded significant market declines. The CAPE of 41.37 in July 2026 exceeds levels seen in 1929 (32.56) and 2007 (27.55), and approaches the 2000 peak (44.20). These three episodes resulted in corrections of 89%, 57%, and 49%, respectively. This historical regularity suggests a statistically significant probability of a major correction.
| Episode | CAPE at Peak | S&P 500 Drop | Duration | Time to Correction |
|---|---|---|---|---|
| 1929 | 32.56 | -89% | 3 years | 2-3 months |
| 2000 | 44.20 | -49% | 2.5 years | 6-12 months |
| 2007 | 27.55 | -57% | 1.5 years | 8-12 months |
| 2026 | 41.37 | ? | ? | ? |
Legend: Historical CAPE peaks and subsequent S&P 500 corrections. The time to correction indicates the interval between the CAPE peak and the start of the major decline. Source: Robert Shiller data, Yale University.
2. The current geopolitical context amplifies systemic risks.
The war between the United States and Iran, initiated on July 12, 2026, represents a major exogenous shock. Attacks on oil tankers in the Strait of Hormuz, the maritime blockade declared by the Houthis, and strikes on U.S. bases in Kuwait create regional instability unprecedented since the 1970s oil crises. An already overvalued market (CAPE at 41.37) is particularly vulnerable to an energy supply shock that could trigger a global recession and a sharp correction in valuations.
3. Mean reversion is a fundamental principle of financial markets.
While CAPE can remain high for extended periods, history shows that reversion eventually occurs. Over a 10-year horizon, a CAPE above 40 is associated with annual real returns of -1% to +2% on average. These low or negative returns necessarily imply substantial intermediate corrections — potentially a 50% drop or more.
1. CAPE predicts long-term returns, not the timing of corrections.
The FALSE side rightly emphasizes that CAPE is a forward-looking indicator of 10-year returns, not a market timing signal. The market can sustain extreme valuations for years (e.g., 1996-2000, 2021-present) before a correction occurs.
2. Reversion can occur through earnings growth, not just price declines.
If earnings increase sufficiently, CAPE can decrease without a fall in prices. The mechanical argument of a 50% price drop to bring CAPE from 41 to 17 assumes earnings stay constant, which is not guaranteed.
3. Uncertainty about timing weakens predictability.
The phrase “predictable future” is ambiguous. If the correction occurs in 5 to 10 years, can it truly be considered “predictable” in the sense of certainty? The FALSE side rightly highlights this epistemological limitation.
Where the TRUE side is correct:
- ■The historical correlation between extreme CAPE and major corrections is factually established.
- ■A CAPE of 41.37 places the market in a historically danger zone associated with high probabilities of severe corrections.
- ■The current geopolitical context (Iran-U.S. war) is a plausible catalyst for a correction, which the extreme valuations make statistically likely.
Where the TRUE side has weaknesses:
- ■The argument of a mechanical 50% decline is overly deterministic. Reversion can occur via earnings growth or over a decade.
- ■Timing remains unpredictable. CAPE can stay elevated for 3, 5, or even 7 years before correction.
- ■The statement “predictable future” lacks precise temporal framing.
Balanced conclusion:
The TRUE thesis is correct in substance: a CAPE of 41.37 indicates a statistically significant probability of a major correction (50%+) within 3 to 10 years. However, it overstates certainty about timing and underestimates alternative reversion mechanisms (earnings growth). The key question is whether the U.S. market will experience such a decline—not when. Based on valuation extremes and geopolitical volatility, the probability is high but not certain, estimated at around 60-70% over a 5-year horizon.
Final suggested vote: The resolution is partially validated. A CAPE of 41.37 makes a correction of 50%+ probable within 3-10 years, but timing remains uncertain, and reversion can occur through mechanisms other than a sharp price drop.
Round 3
Here is the honest and factual assessment of the position refuting the claim that the U.S. market will "inevitably" fall more than 50% to return to a CAPE of 17.
The Clerk rightly raises a tension: a correlation of about −0.55 to −0.65 between CAPE and 10-year real returns (R² ≈ 0.40) is not a "weak link." I acknowledge this data and clarify my position without evasiveness.
The correlation is indeed on a ten-year horizon — but this is precisely what undermines the claim, not what supports it. An R² of 0.40 means that 60% of the variance in future returns remains unexplained by CAPE. Moreover, this correlation pertains to smoothed compounded returns over a decade, not to the probability of a sudden 50% crash. A CAPE of 41 statistically predicts low or slightly negative real returns over ten years — which is perfectly compatible with scenarios of long stagnation, muted returns, or a moderate correction of 15-25%, without ever implying a 50% collapse. My argument has never been that CAPE is without predictive value; it is that its predictive power is expressed in modest decade-long returns, not in specific, dated crashes of a certain magnitude. Confusing "poor returns over ten years" with "a 50% collapse in the foreseeable future" is a logical leap that the data do not support. The inconsistency is thus resolved: I maintain the correlation, I reject the catastrophic inference that is being drawn from it.
1. The reference to "17" is an outdated artifact. The modern average CAPE (post-1945, or even post-1990) is significantly higher than 17, due to accounting changes, persistently lower real rates, and structurally higher margins. The relevant implicit gap is therefore not from 41 down to 17 (−59%) but much more modest. Anchoring a collapse forecast on an unadjusted secular average is methodologically indefensible.
2. CAPE has no short-term synchronization power. The relationship operates over ten years, not one or two. CAPE has been above 30 almost continuously since 2017 — nearly nine years — without the predicted 50% crash. An indicator that remains in "danger territory" for a decade without a trigger is not a signal of imminent collapse. The requirement of the claim — a "collapse in the foreseeable future" — is precisely where CAPE is the weakest.
3. Mean reversion can happen through earnings, not prices. The denominator (real earnings over ten years) mechanically increases as weak years exit the rolling window, lowering CAPE without capital destruction. The most probable scenario is a phase of muted returns, not a crash.
4. The historical sample is cherry-picked and contains an internal counterexample. Three cases (1929, 2000, 2008) do not constitute a law. The opponent himself cited a peak followed by only a 20% decline — which directly refutes the 50% threshold he advocates. And the CAPE of 1997 was followed by +100% before any downturn.
The affirmative side has scored some real points that integrity requires acknowledging:
- ■The current level is genuinely extreme. The CAPE correction to ~41 in July 2026 places it above the peaks of 1929 and 2008, very close to 2000. This is indisputable and a legitimate reason for caution.
- ■Episodes of 2000 (−49%) and 2008 (−57%) are real and occurred after valuation peaks. The claim is therefore not absurd: it is overly deterministic.
- ■The CAPE / 10-year returns correlation is moderate to strong, as the Clerk highlighted — CAPE is not noise.
- ■The geopolitical context (Middle East tensions, Strait of Hormuz) constitutes a plausible risk catalyst that cannot be dismissed outright.
| Point of Dispute | FALSE Side Position | Outcome at the end of the debate |
|---|---|---|
| Reference to "17" | Obsolete; modern ≈ 30+ | Advantage FALSE |
| Short-term predictive power | None / very weak | Advantage FALSE |
| 10-year correlation | Real but → modest returns | Nuanced, shared |
| Precise "−50%" threshold | Not supported by data | Advantage FALSE |
| Current extreme level (~41) | Conceded | Advantage TRUE |
| Geopolitical catalyst | Plausible but not deterministic | Shared |
Legend: Qualitative assessment of points of disagreement between the two sides after three rounds. "Advantage" indicates which side has the most solid evidentiary support on each axis.
The FALSE position does not claim that the market cannot fall — it can, and the current valuation level justifies caution. It demonstrates that the specific claim under debate — a fall of more than 50%, in the foreseeable future, to specifically return to 17 — combines three cumulative errors: a false numerical reference, a synchronization requirement that CAPE cannot fulfill, and a confusion between mediocre decade-long returns and a specific, magnitude-defined crash.
Summary verdict: the claim is refuted not because a decline is impossible, but because its formulation — deterministic, quantified at −50%, anchored on an average of 17, and bounded within a short horizon — far exceeds what empirical data, including the correlation acknowledged by the Clerk, can support. CAPE indicates a decade of likely disappointing returns; it does not, and cannot, predict a 50% collapse within a foreseeable timeframe.
| Debate | TRUE Model | FALSE Model | TRUE Avg μ | FALSE Avg μ | TRUE Tokens | FALSE Tokens | Winner | Verdict | Conf. |
|---|---|---|---|---|---|---|---|---|---|
| #1 | z-ai/glm-5 | openai/gpt-5.4-mini | 0.145 | 0.100 | 33 | 60 | TRUE | FALSE | 75% |
| #2 | z-ai/glm-5 | anthropic/claude-opus-4.8 | 0.000 | 0.000 | 33 | 360 | TRUE | FALSE | 85% |
The following financial data tables were referenced during the debate exchanges:
| Episode | CAPE Maximum | Subsequent Drop | Duration |
|---|---|---|---|
| Great Depression (1929) | 32.6 | -89% | 3 years |
| Internet Bubble (2000) | 44.2 | -49% | 2.5 years |
| Financial Crisis (2008) | 27.4 | -57% | 1.5 years |
| Current Level (2026) | >34 | ? | ? |
Legend: Shiller's CAPE ratio at historical peaks and subsequent corrections of the S&P 500. Source: historical data from Robert Shiller, Yale University.
| Metric | Current Value | Long-term Average | Difference |
|---|---|---|---|
| CAPE Ratio | >34 | 17 | +100% |
| Risk Premium | ~2% | 4-5% | -50% to -60% |
| S&P 500 Margins | 11.5% | 8-9% | +30% |
Legend: Comparison of current valuation metrics of the S&P 500 with their long-term averages. Sources: market data, financial analyses.
| Metric | July 2026 Value | Historical Average | Percentile |
|---|---|---|---|
| CAPE Ratio | 41.37 | 17.0 | 97th |
| Deviation from Average | +143% | — | — |
| Historical Max CAPE | 44.2 (2000) | — | — |
Legend: Shiller's CAPE ratio for the S&P 500, official data as of July 2026. Source: Robert Shiller, Yale University.
| Episode | CAPE at Peak | Maximum Drop | Horizon | 10-Year Return |
|---|---|---|---|---|
| Great Depression (1929) | 32.6 | -89% | 3 years | -1.8%/year |
| Internet Bubble (2000) | 44.2 | -49% | 2.5 years | -2.7%/year |
| Financial Crisis (2008) | 27.4 | -57% | 1.5 years | +3.0%/year |
| Current Level (2026) | 41.37 | ? | ? | ? |
Legend: Historical peaks of CAPE and their market consequences. The 10-year returns are real and annualized. Source: historical analyses based on Robert Shiller's data.
| Initial CAPE | 10-Year Real Return | Negative Probability |
|---|---|---|
| < 15 | +10.3%/year | ~5% |
| 15-20 | +7.1%/year | ~15% |
| 20-25 | +4.6%/year | ~30% |
| 25-30 | +2.3%/year | ~45% |
| > 30 | -0.2%/year | ~60% |
| 41.37 (current) | ~0%/year | ~65% |
Legend: Relationship between initial CAPE level and 10-year real annualized returns. Source: historical analysis based on Robert Shiller's data, period 1881-2026.
| Episode | CAPE at Peak | Max Correction | Time Before Correction | Main Mechanism |
|---|---|---|---|---|
| 1929 | 32.6 | -89% | ~6 months | Stock Market Crash |
| 2000 | 44.2 | -49% | ~6 months | Tech Collapse |
| 2008 | 27.4 | -57% | ~12 months | Financial Crisis |
| 2026 (current) | 41.37 | ? | ? | ? |
Legend: Comparison of historical episodes of extreme CAPE with subsequent corrections. The delay indicates the time between the CAPE peak and the start of the major correction.
| CAPE Reference | Level | Implicit Drop Since 41 |
|---|---|---|
| Adverse assertion ("~17") | 17.0 | -59% |
| Modern long-term average | 32.4 | -21% |
| Typical high range | 36.3 | -12% |
Legend: Comparison of CAPE reference points and the implied price decline since the current level (~41), assuming constant earnings. Sources: market valuation data, July 2026. Unit: ratio and percentage.
| Period | CAPE | Long-term average | Difference from average | Subsequent Drop |
|---|---|---|---|---|
| Sept 1929 | 32.56 | 16.0 | +104% | -89% (1929-1932) |
| Mar 2000 | 44.20 | 16.0 | +176% | -49% (2000-2002) |
| Dec 2007 | 27.55 | 16.0 | +72% | -57% (2007-2009) |
| Jan 2026 | 41.37 | 17.0 | +143% | ? |
Legend: Shiller's CAPE ratio at historical peaks and subsequent drops of the S&P 500. Long-term average ≈ 17. Source: Robert Shiller data, Yale University.
| Episode CAPE > 30 | Year of Surpass | Follow-up 50% Crash? |
|---|---|---|
| Internet Bubble | 1997 | No — then +100% over ~3 years |
| 2000 Peak | 2000 | Partial — ~49% decline over 2.5 years |
| Modern Era | 2017 | No — no 50% crash in ~9 years |
Legend: Episodes where CAPE exceeded 30 and the actual market outcome. The "invariable" threshold of a 50% crash is not reliably validated in any of these cases. Sources: historical valuation series of the S&P 500, 1997–2026.
| Episode | CAPE at Peak | S&P 500 Drop | Duration | Time Before Correction |
|---|---|---|---|---|
| 1929 | 32.56 | -89% | 3 years | 2-3 months |
| 2000 | 44.20 | -49% | 2.5 years | 6-12 months |
| 2007 | 27.55 | -57% | 1.5 years | 8-12 months |
| 2026 | 41.37 | ? | ? | ? |
Legend: Historical peaks of CAPE and subsequent corrections of the S&P 500. The delay before correction indicates the time between the CAPE peak and the start of the major decline. Source: Robert Shiller data, Yale University.
| Disputed Point | FALSE Position | Status at End of Debate |
|---|---|---|
| "17" Reference | Obsolete; modern ≈ 30+ | Advantage FALSE |
| Short-term Predictive Power | None / very weak | Advantage FALSE |
| 10-year Correlation | Real but → modest returns | Nuanced, shared |
| Exact "−50%" Threshold | Not supported by data | Advantage FALSE |
| Current Extreme Level (~41) | Conceded | Advantage TRUE |
| Geopolitical Catalyst | Plausible but non-deterministic | Shared |
Legend: Qualitative assessment of points of disagreement between the two sides at the end of three rounds. "Advantage" indicates which side has the most solid evidentiary support on each axis.
The following is a synthetic dialogue distilled from the full argument memory tree. All arguments from the tournament are represented in their logical depth as a fluid exchange between three voices: the Moderator, the Affirming voice (TRUE), and the Contesting voice (FALSE). When returning to a higher level of argumentation, the Moderator reframes the discussion.
★ Clerk information assessment — based on information and data relevance and accuracy. Rating scale: [0/5] to [★★★★★].
Core claim: An extreme CAPE ratio portends a major correction in the U.S. market.
Argument 1 — Historical precedent: CAPE peaks have systematically preceded major collapses.
American financial history demonstrates a troubling correlation between extreme levels of Shiller's CAPE ratio and subsequent market collapses. In December 1929, the CAPE reached 32.6 just before the market collapsed by 89% over three years. In March 2000, during the tech bubble, the CAPE rose to 44.2, preceding a 49% drop in the S&P 500. In 2008, a CAPE of 27.4 signaled the imminent financial crisis that decimated 57% of the market value. Today, with a CAPE exceeding 34, the market is in the 90th percentile historically, a territory that has invariably preceded major corrections. The historical average of 17 represents the fundamental balance toward which valuations should converge. This financial gravity cannot be indefinitely deferred.
Core claim: An extreme CAPE ratio portends a major correction in the U.S. market.
Argument 1 — Historical precedent: CAPE peaks have systematically preceded major collapses.
American financial history demonstrates a troubling correlation between extreme levels of Shiller's CAPE ratio and subsequent market collapses. In December 1929, the CAPE reached 32.6 just before the market collapsed by 89% over three years. In March 2000, during the tech bubble, the CAPE rose to 44.2, preceding a 49% drop in the S&P 500. In 2008, a CAPE of 27.4 signaled the imminent financial crisis that decimated 57% of the market value. Today, with a CAPE exceeding 34, the market is in the 90th percentile historically, a territory that has invariably preceded major corrections. The historical average of 17 represents the fundamental balance toward which valuations should converge. This financial gravity cannot be indefinitely deferred.
openai/gpt-5.4-mini (FALSE): [★★★] High CAPE signals lower future returns, not a systematic 50%+ crash.
You contest the idea that past CAPE peaks "invariably" predict a major fall. It’s too deterministic: history shows at best an association with lower future returns, not a crash rule. Syntheses on the CAPE conclude that it can shed light on long-term returns but is not a reliable market timing tool nor a systematic predictor of a given collapse. (papers.ssrn.com)
Moreover, citing 1929, 2000, and 2008 as "systematic" proof is selecting extreme cases, not a law. The U.S. market has experienced other episodes of high CAPE without an immediate 50% decline; and even during periods of extreme valuation, the most robust relationship concerns the reduction in expected returns over several years, not a specific threshold of decline or a near-term timeline. In other words, a high CAPE can signal an expensive market, but it does not suffice to demonstrate that a correction of more than 50% is likely in the foreseeable future. (papers.ssrn.com)
Finally, the "90th percentile" thesis does not overturn the argument: an extreme valuation level describes a risk, not a fatality. Recent studies on valuation extremes...
z-ai/glm-5 (TRUE): [★★★★★] Historical precedent of CAPE peaks — The peaks in 1929, 2000, and 2008 have systematically preceded major market collapses. Currently above 34, the CAPE is in the 90th percentile, an area that has invariably signaled corrections.
openai/gpt-5.4-mini (FALSE): [0/5] A high CAPE does not imply a 50% collapse.
Core claim: A high CAPE does not imply a 50% collapse.
First, the link between high CAPE and deep crash is much weaker than the thesis suggests. Recent work re-examining CAPE's predictive ability for U.S. crashes concludes that, once construction inconsistencies are corrected, its predictive power diminishes significantly and no comprehensive test shows useful economic predictive ability for market timing. In other words, a high valuation may forecast modest future returns but not necessarily a collapse of more than 50%. (papers.ssrn.com)
Second, the most robust historical relationship concerns long-term returns, not a specific decline threshold. Literature favoring CAPE mainly discusses a decrease in expected returns over 10 to 15 years, which is very different from predicting an imminent 50% collapse of the index. Several studies show that valuations can be useful for tempering return expectations without providing a precise calendar or an extreme correction magnitude. (papers.ssrn.com)
Third, the history of the U.S. market shows that booms and stretched valuations tend to increase...
z-ai/glm-5 (TRUE): [★★★★★] Mean reversion — The CAPE at 34 should revert to its historical average of 17. With stagnant earnings, a 50% correction is mathematically necessary. The compressed risk premium and high real rates expose the market to a reevaluation.
deepseek/deepseek-v4-flash (Moderator): A high CAPE does not imply a 50% collapse.
Core claim: A high CAPE does not imply a 50% collapse.
First, the link between high CAPE and deep crash is much weaker than the thesis suggests. Recent re-examinations of CAPE's predictive capacity for U.S. crashes conclude that, once construction inconsistencies are corrected, its predictive power diminishes significantly and no comprehensive test shows useful economic predictive ability for market timing. In other words, a high valuation may forecast modest future returns but not necessarily a collapse of more than 50%. (papers.ssrn.com)
Second, the most robust historical relationship concerns long-term returns, not a specific decline threshold. Literature favoring CAPE mainly discusses a decrease in expected returns over 10 to 15 years, which is very different from predicting an imminent 50% collapse of the index. Several studies show that valuations can be useful for tempering return expectations without providing a precise calendar or an extreme correction magnitude. (papers.ssrn.com)
Third, the history of the U.S. market shows that booms and stretched valuations tend to increase...
z-ai/glm-5 (TRUE): [0/5] Mean reversion — The CAPE at 34 should revert to its historical average of 17. With stagnant earnings, a 50% correction is mathematically necessary. The risk premium is compressed and real rates are high, exposing the market to a reevaluation.
openai/gpt-5.4-mini (FALSE): [★] I add that boom phases mainly increase volatility and the risk of future losses, but they do not make the timing of a deep crash predictable with certainty. In other words, a high CAPE can signal lower future returns, without necessarily supporting the specific thesis of a plunge of more than 50%.
openai/gpt-5.4-mini (FALSE): [0/5] I also think that the argument of mean reversion is too simplified: a decrease in CAPE can result from an improvement in earnings, not only from a collapse in stock prices. To fall from 34 to 17, it is not necessary for the index to lose half its value if profits increase significantly.
openai/gpt-5.4-mini (FALSE): [0/5] In practice, the most robust CAPE signal concerns long-term returns, not the magnitude or timing of a crash. So I contest the strong assertion: a high valuation can predict disappointing performance, but not necessarily a 50% decline within a "predictable" horizon.
The debaters consulted the following Solsice slash-command tools (/GLOBALREPORT, /ECO, /TECHNICALS, …) — exposed as first-class MCP tools. Each block below is the raw output retrieved during the debate.
MCP tool: generate_global_report
| Index | YTD % | 6m % | 3m % | 1m % | 1w % | 1d % | Last |
|---|---|---|---|---|---|---|---|
| S&P 500 | - | - | - | - | - | - | - |
| Dow Jones Industrial Average | - | - | - | - | - | - | - |
| S&P 500 Equal Weighted | - | - | - | - | - | - | - |
| Dow Jones US | - | - | - | - | - | - | - |
| Dow Jones Large-Cap | - | - | - | - | - | - | - |
| Index | YTD % | 6m % | 3m % | 1m % | 1w % | 1d % | Last |
|---|---|---|---|---|---|---|---|
| Dow Jones Asset Managers | - | - | - | - | - | - | - |
| Dow Jones U.S. Financials | - | - | - | - | - | - | - |
| Dow Jones Life Insurance | - | - | - | - | - | - | - |
| Dow Jones Banks | - | - | - | - | - | - | - |
| Dow Jones Investment Services | - | - | - | - | - | - | - |
| Index | YTD % | 6m % | 3m % | 1m % | 1w % | 1d % | Last |
|---|---|---|---|---|---|---|---|
| Dow Jones Automobiles | - | - | - | - | - | - | - |
| Dow Jones Diversified Industrials | - | - | - | - | - | - | - |
| Dow Jones Oil & Gas | - | - | - | - | - | - | - |
| Dow Jones Telecommunications | - | - | - | - | - | - | - |
| Dow Jones Diversified REITs | - | - | - | - | - | - | - |
| Index | YTD % | 6m % | 3m % | 1m % | 1w % | 1d % | Last |
|---|---|---|---|---|---|---|---|
| Dow Jones Defense | - | - | - | - | - | - | - |
| Dow Jones Health Care Providers | - | - | - | - | - | - | - |
| Dow Jones Software | - | - | - | - | - | - | - |
| Dow Jones Semiconductors | - | - | - | - | - | - | - |
| Dow Jones Biotechnology | - | - | - | - | - | - | - |
…(truncated)…
Face-off transcripts
- ■
Ownership & Trade Secrets. The Company Lambda Vision retains all rights to its platform, agentic workflows, and proprietary financial methodologies, which constitute protected Trade Secrets (EU Directive 2016/943). Subject to full payment of tokens, the User is granted ownership of the generated Reports for their own professional use. Reverse-engineering the Service or using Reports to train competing AI models is strictly prohibited.
- ■
No Financial Advice. The Service and Reports are for informational purposes only and do not constitute financial, investment, legal, or tax advice. The Company is not a regulated financial advisor. AI-generated outputs may contain errors; the User is solely responsible for verifying data and assumes all risks for any financial decisions or losses.
- ■
Liability & Governing Law. To the maximum extent permitted by law, the Company shall not be liable for any indirect or financial damages. These Terms are governed by French law. Any disputes shall be subject to the exclusive jurisdiction of the Courts of Paris, France.